

14 Surface Water Eutrophication in Poland: Assessment and Prevention
335
0
5
10
15
20
25
30
35
40
Germany
Denmark
Sweden
Finland
Russia
Estonia
Latvia
Lithuania
Poland
Share in total nutrients load, %
Total Phosphorus
Total Nitrogen
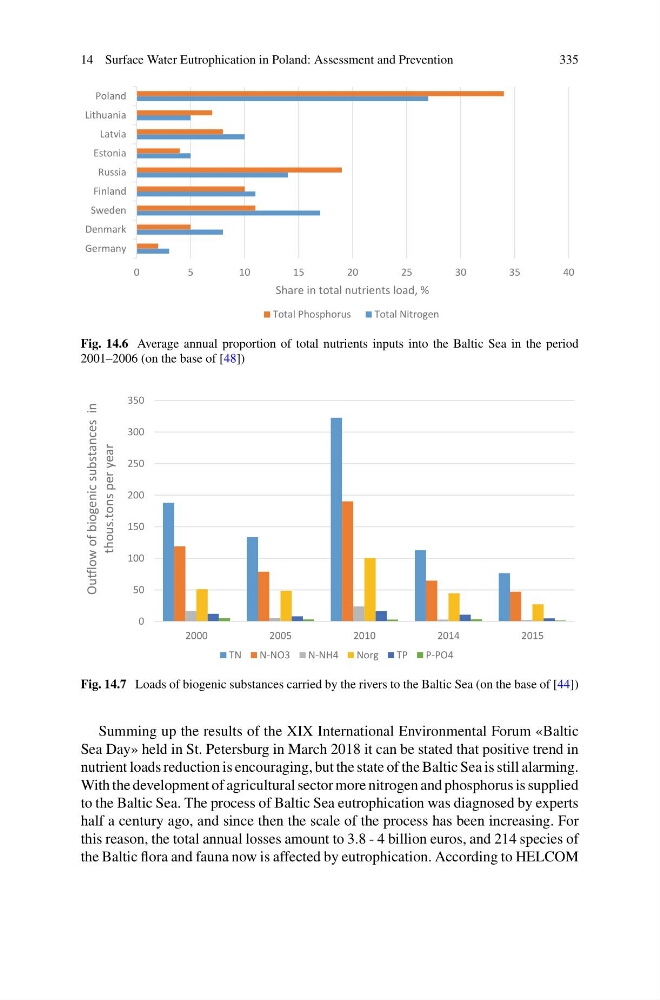
Fig. 14.6 Average annual proportion of total nutrients inputs into the Baltic Sea in the period
2001–2006 (on the base of [48])
0
50
100
150
200
250
300
350
2000
2005
2010
2014
2015
Ouƞlow of biogenic substances in
thous.tons per year
TN
N-NO3
N-NH4
Norg
TP
P-PO4
Fig. 14.7 Loads of biogenic substances carried by the rivers to the Baltic Sea (on the base of [44])
Summing up the results of the XIX International Environmental Forum «Baltic
Sea Day» held in St. Petersburg in March 2018 it can be stated that positive trend in
nutrient loads reduction is encouraging, but the state of the Baltic Sea is still alarming.
With the development of agricultural sector more nitrogen and phosphorus is supplied
to the Baltic Sea. The process of Baltic Sea eutrophication was diagnosed by experts
half a century ago, and since then the scale of the process has been increasing. For
this reason, the total annual losses amount to 3.8 - 4 billion euros, and 214 species of
the Baltic flora and fauna now is affected by eutrophication. According to HELCOM
335
0
5
10
15
20
25
30
35
40
Germany
Denmark
Sweden
Finland
Russia
Estonia
Latvia
Lithuania
Poland
Share in total nutrients load, %
Total Phosphorus
Total Nitrogen
Fig. 14.6 Average annual proportion of total nutrients inputs into the Baltic Sea in the period
2001–2006 (on the base of [48])
0
50
100
150
200
250
300
350
2000
2005
2010
2014
2015
Ouƞlow of biogenic substances in
thous.tons per year
TN
N-NO3
N-NH4
Norg
TP
P-PO4
Fig. 14.7 Loads of biogenic substances carried by the rivers to the Baltic Sea (on the base of [44])
Summing up the results of the XIX International Environmental Forum «Baltic
Sea Day» held in St. Petersburg in March 2018 it can be stated that positive trend in
nutrient loads reduction is encouraging, but the state of the Baltic Sea is still alarming.
With the development of agricultural sector more nitrogen and phosphorus is supplied
to the Baltic Sea. The process of Baltic Sea eutrophication was diagnosed by experts
half a century ago, and since then the scale of the process has been increasing. For
this reason, the total annual losses amount to 3.8 - 4 billion euros, and 214 species of
the Baltic flora and fauna now is affected by eutrophication. According to HELCOM