

12 Sediment Management in River Basins: An Essential Element …
275
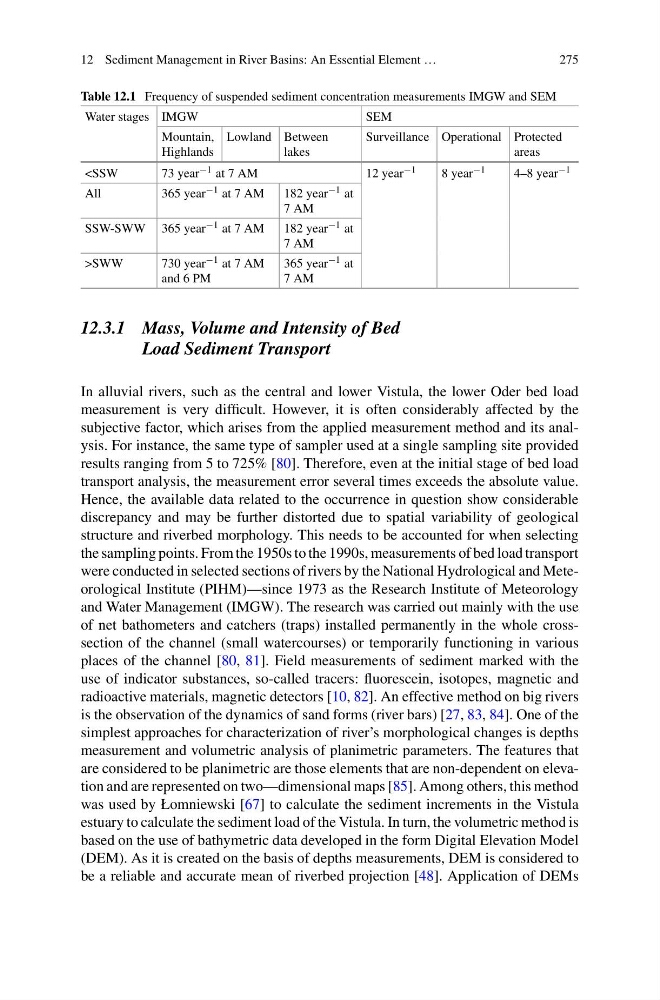
Table 12.1 Frequency of suspended sediment concentration measurements IMGW and SEM
Water stages IMGW
SEM
Mountain,
Highlands
Lowland Between
lakes
Surveillance Operational Protected
areas
12 year −1
8 year −1
4–8 year −1
All
365 year −1 at 7 AM
182 year −1 at
7 AM
SSW-SWW 365 year −1 at 7 AM
182 year −1 at
7 AM
>SWW
730 year −1 at 7 AM
and 6 PM
365 year −1 at
7 AM
12.3.1 Mass, Volume and Intensity of Bed
Load Sediment Transport
In alluvial rivers, such as the central and lower Vistula, the lower Oder bed load
measurement is very difficult. However, it is often considerably affected by the
subjective factor, which arises from the applied measurement method and its analysis. For instance, the same type of sampler used at a single sampling site provided
results ranging from 5 to 725% [80]. Therefore, even at the initial stage of bed load
transport analysis, the measurement error several times exceeds the absolute value.
Hence, the available data related to the occurrence in question show considerable
discrepancy and may be further distorted due to spatial variability of geological
structure and riverbed morphology. This needs to be accounted for when selecting
the sampling points. From the 1950s to the 1990s, measurements of bed load transport
were conducted in selected sections of rivers by the National Hydrological and Meteorological Institute (PIHM)—since 1973 as the Research Institute of Meteorology
and Water Management (IMGW). The research was carried out mainly with the use
of net bathometers and catchers (traps) installed permanently in the whole crosssection of the channel (small watercourses) or temporarily functioning in various
places of the channel [80, 81]. Field measurements of sediment marked with the
use of indicator substances, so-called tracers: fluorescein, isotopes, magnetic and
radioactive materials, magnetic detectors [10, 82]. An effective method on big rivers
is the observation of the dynamics of sand forms (river bars) [27, 83, 84]. One of the
simplest approaches for characterization of river’s morphological changes is depths
measurement and volumetric analysis of planimetric parameters. The features that
are considered to be planimetric are those elements that are non-dependent on elevation and are represented on two—dimensional maps [85]. Among others, this method
was used by Łomniewski [67] to calculate the sediment increments in the Vistula
estuary to calculate the sediment load of the Vistula. In turn, the volumetric method is
based on the use of bathymetric data developed in the form Digital Elevation Model
(DEM). As it is created on the basis of depths measurements, DEM is considered to
be a reliable and accurate mean of riverbed projection [48]. Application of DEMs
275
Table 12.1 Frequency of suspended sediment concentration measurements IMGW and SEM
Water stages IMGW
SEM
Mountain,
Highlands
Lowland Between
lakes
Surveillance Operational Protected
areas
12 year −1
8 year −1
4–8 year −1
All
365 year −1 at 7 AM
182 year −1 at
7 AM
SSW-SWW 365 year −1 at 7 AM
182 year −1 at
7 AM
>SWW
730 year −1 at 7 AM
and 6 PM
365 year −1 at
7 AM
12.3.1 Mass, Volume and Intensity of Bed
Load Sediment Transport
In alluvial rivers, such as the central and lower Vistula, the lower Oder bed load
measurement is very difficult. However, it is often considerably affected by the
subjective factor, which arises from the applied measurement method and its analysis. For instance, the same type of sampler used at a single sampling site provided
results ranging from 5 to 725% [80]. Therefore, even at the initial stage of bed load
transport analysis, the measurement error several times exceeds the absolute value.
Hence, the available data related to the occurrence in question show considerable
discrepancy and may be further distorted due to spatial variability of geological
structure and riverbed morphology. This needs to be accounted for when selecting
the sampling points. From the 1950s to the 1990s, measurements of bed load transport
were conducted in selected sections of rivers by the National Hydrological and Meteorological Institute (PIHM)—since 1973 as the Research Institute of Meteorology
and Water Management (IMGW). The research was carried out mainly with the use
of net bathometers and catchers (traps) installed permanently in the whole crosssection of the channel (small watercourses) or temporarily functioning in various
places of the channel [80, 81]. Field measurements of sediment marked with the
use of indicator substances, so-called tracers: fluorescein, isotopes, magnetic and
radioactive materials, magnetic detectors [10, 82]. An effective method on big rivers
is the observation of the dynamics of sand forms (river bars) [27, 83, 84]. One of the
simplest approaches for characterization of river’s morphological changes is depths
measurement and volumetric analysis of planimetric parameters. The features that
are considered to be planimetric are those elements that are non-dependent on elevation and are represented on two—dimensional maps [85]. Among others, this method
was used by Łomniewski [67] to calculate the sediment increments in the Vistula
estuary to calculate the sediment load of the Vistula. In turn, the volumetric method is
based on the use of bathymetric data developed in the form Digital Elevation Model
(DEM). As it is created on the basis of depths measurements, DEM is considered to
be a reliable and accurate mean of riverbed projection [48]. Application of DEMs