

274
M. Habel et al.
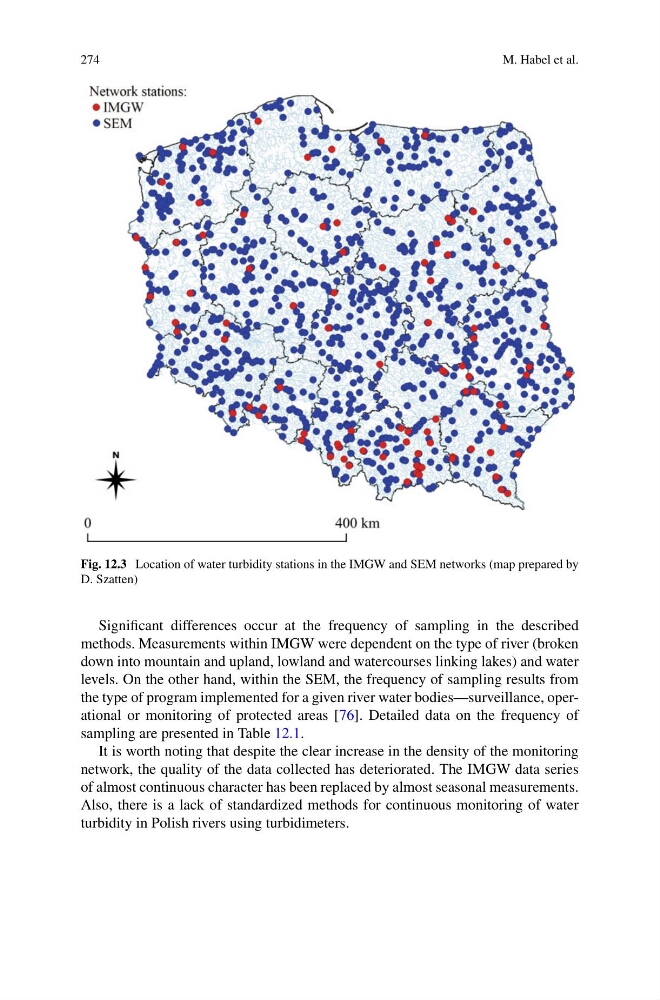
Fig. 12.3 Location of water turbidity stations in the IMGW and SEM networks (map prepared by
D. Szatten)
Significant differences occur at the frequency of sampling in the described
methods. Measurements within IMGW were dependent on the type of river (broken
down into mountain and upland, lowland and watercourses linking lakes) and water
levels. On the other hand, within the SEM, the frequency of sampling results from
the type of program implemented for a given river water bodies—surveillance, operational or monitoring of protected areas [76]. Detailed data on the frequency of
sampling are presented in Table 12.1.
It is worth noting that despite the clear increase in the density of the monitoring
network, the quality of the data collected has deteriorated. The IMGW data series
of almost continuous character has been replaced by almost seasonal measurements.
Also, there is a lack of standardized methods for continuous monitoring of water
turbidity in Polish rivers using turbidimeters.
M. Habel et al.
Fig. 12.3 Location of water turbidity stations in the IMGW and SEM networks (map prepared by
D. Szatten)
Significant differences occur at the frequency of sampling in the described
methods. Measurements within IMGW were dependent on the type of river (broken
down into mountain and upland, lowland and watercourses linking lakes) and water
levels. On the other hand, within the SEM, the frequency of sampling results from
the type of program implemented for a given river water bodies—surveillance, operational or monitoring of protected areas [76]. Detailed data on the frequency of
sampling are presented in Table 12.1.
It is worth noting that despite the clear increase in the density of the monitoring
network, the quality of the data collected has deteriorated. The IMGW data series
of almost continuous character has been replaced by almost seasonal measurements.
Also, there is a lack of standardized methods for continuous monitoring of water
turbidity in Polish rivers using turbidimeters.