

11 Monitoring of Groundwater Quality in Poland
257
320.86
303.78
303.78
317
309
18
20.3
28
18.1
20.2
73.73
72.78
67.97
73.8
71.6
0.73
0.51
0.61
0.84
0.86
118
124
130
128
123
2013
2014
2015
2016
2017
I/911/4 K
ClNa+
Fe
SO42401.38
419.68
407.48
460
371
10.5
95.7
102
89.3
9.51
12.15
146.56
145.63
154
11.1
0
3.55
3.27
3.21
2.64
97.9
3.91
0
0
65.6
2013
2014
2015
2016
2017
I/388/1 K
ClNa+
Fe
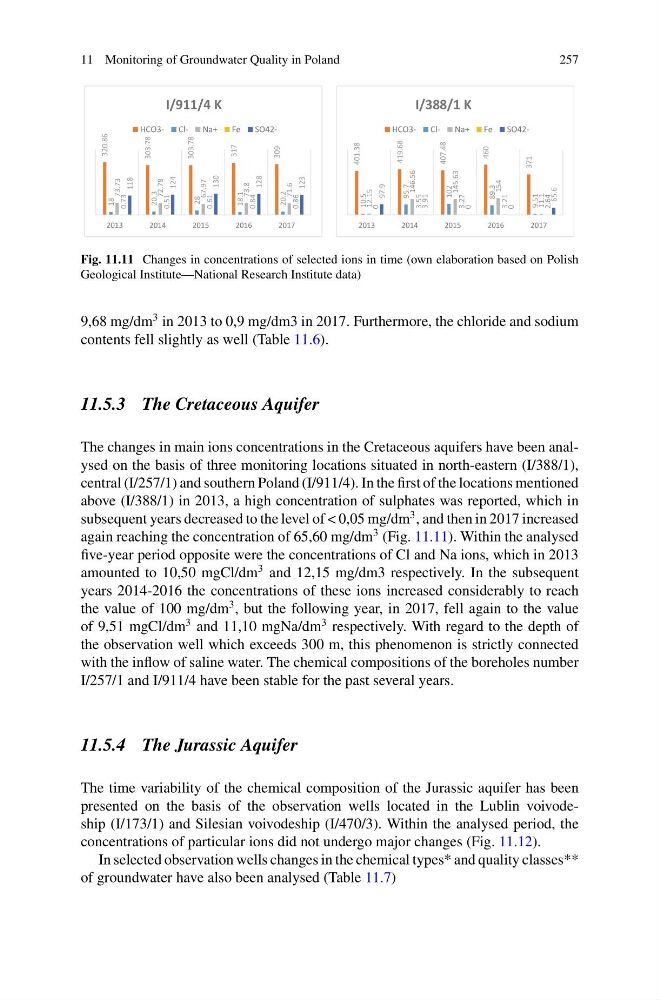
SO42Fig. 11.11 Changes in concentrations of selected ions in time (own elaboration based on Polish
Geological Institute—National Research Institute data)
9,68 mg/dm
3 in 2013 to 0,9 mg/dm3 in 2017. Furthermore, the chloride and sodium
contents fell slightly as well (Table 11.6).
11.5.3 The Cretaceous Aquifer
The changes in main ions concentrations in the Cretaceous aquifers have been analysed on the basis of three monitoring locations situated in north-eastern (I/388/1),
central (I/257/1) and southern Poland (I/911/4). In the first of the locations mentioned
above (I/388/1) in 2013, a high concentration of sulphates was reported, which in
subsequent years decreased to the level of < 0,05 mg/dm
3 , and then in 2017 increased
again reaching the concentration of 65,60 mg/dm
3 (Fig. 11.11). Within the analysed
five-year period opposite were the concentrations of Cl and Na ions, which in 2013
amounted to 10,50 mgCl/dm
3 and 12,15 mg/dm3 respectively. In the subsequent
years 2014-2016 the concentrations of these ions increased considerably to reach
the value of 100 mg/dm
3 , but the following year, in 2017, fell again to the value
of 9,51 mgCl/dm
3 and 11,10 mgNa/dm
3 respectively. With regard to the depth of
the observation well which exceeds 300 m, this phenomenon is strictly connected
with the inflow of saline water. The chemical compositions of the boreholes number
I/257/1 and I/911/4 have been stable for the past several years.
11.5.4 The Jurassic Aquifer
The time variability of the chemical composition of the Jurassic aquifer has been
presented on the basis of the observation wells located in the Lublin voivodeship (I/173/1) and Silesian voivodeship (I/470/3). Within the analysed period, the
concentrations of particular ions did not undergo major changes (Fig. 11.12).
In selected observation wells changes in the chemical types* and quality classes**
of groundwater have also been analysed (Table 11.7)
257
320.86
303.78
303.78
317
309
18
20.3
28
18.1
20.2
73.73
72.78
67.97
73.8
71.6
0.73
0.51
0.61
0.84
0.86
118
124
130
128
123
2013
2014
2015
2016
2017
I/911/4 K
ClNa+
Fe
SO42401.38
419.68
407.48
460
371
10.5
95.7
102
89.3
9.51
12.15
146.56
145.63
154
11.1
0
3.55
3.27
3.21
2.64
97.9
3.91
0
0
65.6
2013
2014
2015
2016
2017
I/388/1 K
ClNa+
Fe
SO42Fig. 11.11 Changes in concentrations of selected ions in time (own elaboration based on Polish
Geological Institute—National Research Institute data)
9,68 mg/dm
3 in 2013 to 0,9 mg/dm3 in 2017. Furthermore, the chloride and sodium
contents fell slightly as well (Table 11.6).
11.5.3 The Cretaceous Aquifer
The changes in main ions concentrations in the Cretaceous aquifers have been analysed on the basis of three monitoring locations situated in north-eastern (I/388/1),
central (I/257/1) and southern Poland (I/911/4). In the first of the locations mentioned
above (I/388/1) in 2013, a high concentration of sulphates was reported, which in
subsequent years decreased to the level of < 0,05 mg/dm
3 , and then in 2017 increased
again reaching the concentration of 65,60 mg/dm
3 (Fig. 11.11). Within the analysed
five-year period opposite were the concentrations of Cl and Na ions, which in 2013
amounted to 10,50 mgCl/dm
3 and 12,15 mg/dm3 respectively. In the subsequent
years 2014-2016 the concentrations of these ions increased considerably to reach
the value of 100 mg/dm
3 , but the following year, in 2017, fell again to the value
of 9,51 mgCl/dm
3 and 11,10 mgNa/dm
3 respectively. With regard to the depth of
the observation well which exceeds 300 m, this phenomenon is strictly connected
with the inflow of saline water. The chemical compositions of the boreholes number
I/257/1 and I/911/4 have been stable for the past several years.
11.5.4 The Jurassic Aquifer
The time variability of the chemical composition of the Jurassic aquifer has been
presented on the basis of the observation wells located in the Lublin voivodeship (I/173/1) and Silesian voivodeship (I/470/3). Within the analysed period, the
concentrations of particular ions did not undergo major changes (Fig. 11.12).
In selected observation wells changes in the chemical types* and quality classes**
of groundwater have also been analysed (Table 11.7)