

136
A. Solarczyk
6.3.3 Water Quality Variability in Poland’s Major Rivers
Water quality in Poland’s main and longest rivers is conditioned by the export of
pollutants from the largest tributary catchments and affected by the direct inflow of
sewage from point sources in the largest cities or near major industrial plants. Studies
of water quality indicators along the course of the main rivers make it possible to
approximately assess the extent of anthropogenic impact in individual sections. In
2010–2015, water quality was monitored in various years in Poland’s six longest
rivers: the Vistula and its tributaries (the San, Narew, and Bug), the Oder and the
Warta.
Water quality varies markedly between Poland’s largest rivers, and along their
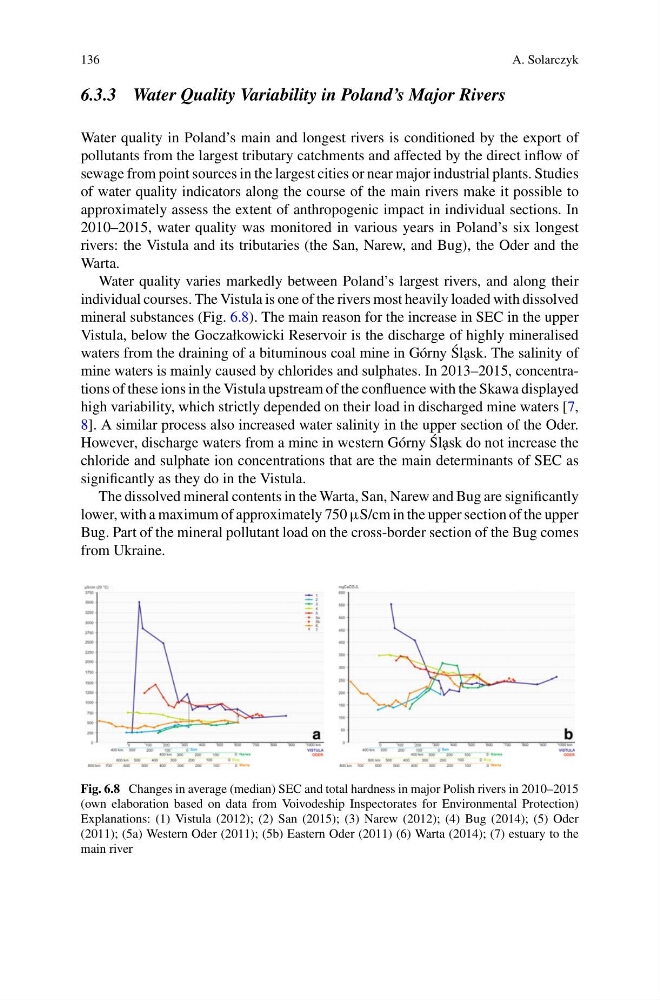
individual courses. The Vistula is one of the rivers most heavily loaded with dissolved
mineral substances (Fig. 6.8). The main reason for the increase in SEC in the upper
Vistula, below the Goczałkowicki Reservoir is the discharge of highly mineralised
waters from the draining of a bituminous coal mine in Górny ´
Sl˛ ask. The salinity of
mine waters is mainly caused by chlorides and sulphates. In 2013–2015, concentrations of these ions in the Vistula upstream of the confluence with the Skawa displayed
high variability, which strictly depended on their load in discharged mine waters [7,
8]. A similar process also increased water salinity in the upper section of the Oder.
However, discharge waters from a mine in western Górny ´
Sl˛ ask do not increase the
chloride and sulphate ion concentrations that are the main determinants of SEC as
significantly as they do in the Vistula.
The dissolved mineral contents in the Warta, San, Narew and Bug are significantly
lower, with a maximum of approximately 750 µS/cm in the upper section of the upper
Bug. Part of the mineral pollutant load on the cross-border section of the Bug comes
from Ukraine.
Fig. 6.8 Changes in average (median) SEC and total hardness in major Polish rivers in 2010–2015
(own elaboration based on data from Voivodeship Inspectorates for Environmental Protection)
Explanations: (1) Vistula (2012); (2) San (2015); (3) Narew (2012); (4) Bug (2014); (5) Oder
(2011); (5a) Western Oder (2011); (5b) Eastern Oder (2011) (6) Warta (2014); (7) estuary to the
main river
A. Solarczyk
6.3.3 Water Quality Variability in Poland’s Major Rivers
Water quality in Poland’s main and longest rivers is conditioned by the export of
pollutants from the largest tributary catchments and affected by the direct inflow of
sewage from point sources in the largest cities or near major industrial plants. Studies
of water quality indicators along the course of the main rivers make it possible to
approximately assess the extent of anthropogenic impact in individual sections. In
2010–2015, water quality was monitored in various years in Poland’s six longest
rivers: the Vistula and its tributaries (the San, Narew, and Bug), the Oder and the
Warta.
Water quality varies markedly between Poland’s largest rivers, and along their
individual courses. The Vistula is one of the rivers most heavily loaded with dissolved
mineral substances (Fig. 6.8). The main reason for the increase in SEC in the upper
Vistula, below the Goczałkowicki Reservoir is the discharge of highly mineralised
waters from the draining of a bituminous coal mine in Górny ´
Sl˛ ask. The salinity of
mine waters is mainly caused by chlorides and sulphates. In 2013–2015, concentrations of these ions in the Vistula upstream of the confluence with the Skawa displayed
high variability, which strictly depended on their load in discharged mine waters [7,
8]. A similar process also increased water salinity in the upper section of the Oder.
However, discharge waters from a mine in western Górny ´
Sl˛ ask do not increase the
chloride and sulphate ion concentrations that are the main determinants of SEC as
significantly as they do in the Vistula.
The dissolved mineral contents in the Warta, San, Narew and Bug are significantly
lower, with a maximum of approximately 750 µS/cm in the upper section of the upper
Bug. Part of the mineral pollutant load on the cross-border section of the Bug comes
from Ukraine.
Fig. 6.8 Changes in average (median) SEC and total hardness in major Polish rivers in 2010–2015
(own elaboration based on data from Voivodeship Inspectorates for Environmental Protection)
Explanations: (1) Vistula (2012); (2) San (2015); (3) Narew (2012); (4) Bug (2014); (5) Oder
(2011); (5a) Western Oder (2011); (5b) Eastern Oder (2011) (6) Warta (2014); (7) estuary to the
main river