

pH, water temperature and total alkalinity [34]. Because the lower Seine is the most
impacted sector of the river, pCO 2 values were compared upstream of Paris and
downstream at Poses (the outlet of the river). Upstream of Paris, pCO 2 oscillated
around 4,000 ppm during the 1970–2015 period. A maximum supersaturation of
10,000–12,000 ppm was reached downstream of Paris during the period of maximum organic pollution (1985–2000). BOD emitted from WWTPs indeed followed
the exact same pattern as pCO 2 [34] and therefore directly contributed to the CO 2
budget through direct outflows in the river system. Improvements of wastewater
treatments in WWTPs therefore had a positive effect not only on water quality in
terms of oxygenation, nutrients and eutrophication (see Fig. 5) but also on pCO 2 and
hence on CO 2 emissions by the river network.
To determine diffuse sources, values from the ADES database (www.ades.
eaufrance.fr, last accessed on 2018/11/05) and our own pCO 2 measurements in
piezometers were used. Data provided at the scale of the whole Seine basin were
grouped by water body units according to the lithology and stratigraphy [34, 59].
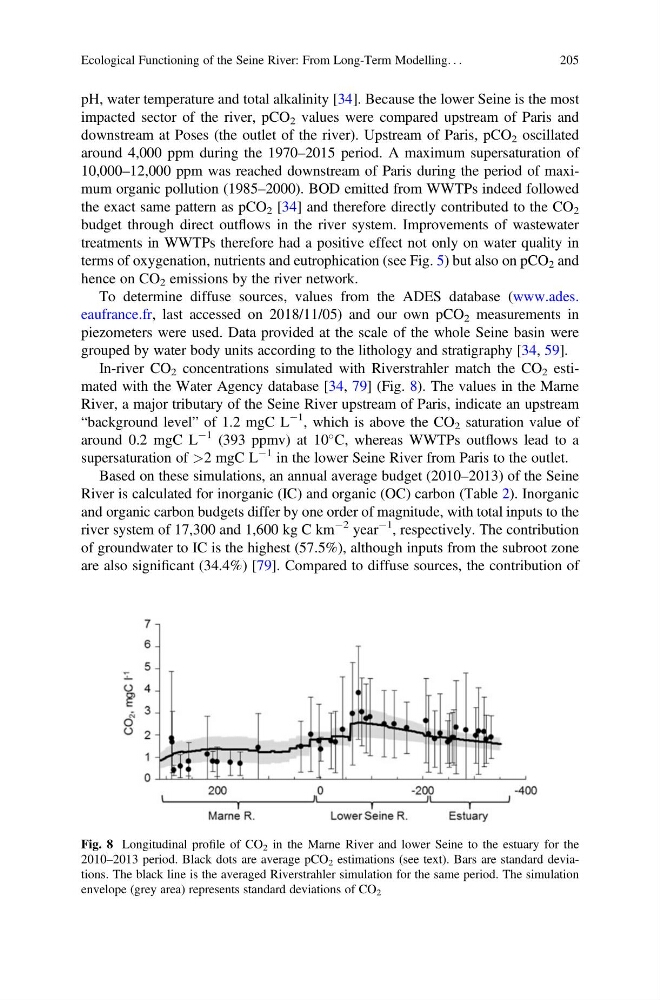
In-river CO 2 concentrations simulated with Riverstrahler match the CO 2 estimated with the Water Agency database [34, 79] (Fig. 8). The values in the Marne
River, a major tributary of the Seine River upstream of Paris, indicate an upstream
“background level” of 1.2 mgC L
À1 , which is above the CO 2 saturation value of
around 0.2 mgC L
À1 (393 ppmv) at 10
C, whereas WWTPs outflows lead to a
supersaturation of >2 mgC L
À1 in the lower Seine River from Paris to the outlet.
Based on these simulations, an annual average budget (2010–2013) of the Seine
River is calculated for inorganic (IC) and organic (OC) carbon (Table 2). Inorganic
and organic carbon budgets differ by one order of magnitude, with total inputs to the
river system of 17,300 and 1,600 kg C km
À2 year
À1 , respectively. The contribution
of groundwater to IC is the highest (57.5%), although inputs from the subroot zone
are also significant (34.4%) [79]. Compared to diffuse sources, the contribution of
Fig. 8 Longitudinal profile of CO 2 in the Marne River and lower Seine to the estuary for the
2010–2013 period. Black dots are average pCO 2 estimations (see text). Bars are standard deviations. The black line is the averaged Riverstrahler simulation for the same period. The simulation
envelope (grey area) represents standard deviations of CO 2
Ecological Functioning of the Seine River: From Long-Term Modelling. . .
205
impacted sector of the river, pCO 2 values were compared upstream of Paris and
downstream at Poses (the outlet of the river). Upstream of Paris, pCO 2 oscillated
around 4,000 ppm during the 1970–2015 period. A maximum supersaturation of
10,000–12,000 ppm was reached downstream of Paris during the period of maximum organic pollution (1985–2000). BOD emitted from WWTPs indeed followed
the exact same pattern as pCO 2 [34] and therefore directly contributed to the CO 2
budget through direct outflows in the river system. Improvements of wastewater
treatments in WWTPs therefore had a positive effect not only on water quality in
terms of oxygenation, nutrients and eutrophication (see Fig. 5) but also on pCO 2 and
hence on CO 2 emissions by the river network.
To determine diffuse sources, values from the ADES database (www.ades.
eaufrance.fr, last accessed on 2018/11/05) and our own pCO 2 measurements in
piezometers were used. Data provided at the scale of the whole Seine basin were
grouped by water body units according to the lithology and stratigraphy [34, 59].
In-river CO 2 concentrations simulated with Riverstrahler match the CO 2 estimated with the Water Agency database [34, 79] (Fig. 8). The values in the Marne
River, a major tributary of the Seine River upstream of Paris, indicate an upstream
“background level” of 1.2 mgC L
À1 , which is above the CO 2 saturation value of
around 0.2 mgC L
À1 (393 ppmv) at 10
C, whereas WWTPs outflows lead to a
supersaturation of >2 mgC L
À1 in the lower Seine River from Paris to the outlet.
Based on these simulations, an annual average budget (2010–2013) of the Seine
River is calculated for inorganic (IC) and organic (OC) carbon (Table 2). Inorganic
and organic carbon budgets differ by one order of magnitude, with total inputs to the
river system of 17,300 and 1,600 kg C km
À2 year
À1 , respectively. The contribution
of groundwater to IC is the highest (57.5%), although inputs from the subroot zone
are also significant (34.4%) [79]. Compared to diffuse sources, the contribution of
Fig. 8 Longitudinal profile of CO 2 in the Marne River and lower Seine to the estuary for the
2010–2013 period. Black dots are average pCO 2 estimations (see text). Bars are standard deviations. The black line is the averaged Riverstrahler simulation for the same period. The simulation
envelope (grey area) represents standard deviations of CO 2
Ecological Functioning of the Seine River: From Long-Term Modelling. . .
205