

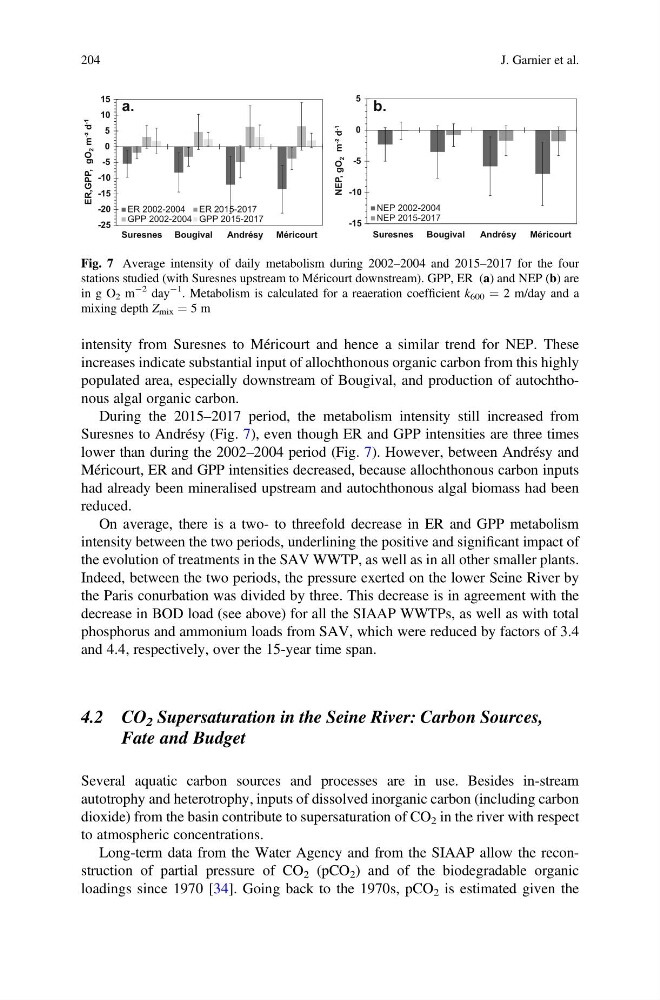
intensity from Suresnes to Méricourt and hence a similar trend for NEP. These
increases indicate substantial input of allochthonous organic carbon from this highly
populated area, especially downstream of Bougival, and production of autochthonous algal organic carbon.
During the 2015–2017 period, the metabolism intensity still increased from
Suresnes to Andrésy (Fig. 7), even though ER and GPP intensities are three times
lower than during the 2002–2004 period (Fig. 7). However, between Andrésy and
Méricourt, ER and GPP intensities decreased, because allochthonous carbon inputs
had already been mineralised upstream and autochthonous algal biomass had been
reduced.
On average, there is a two- to threefold decrease in ER and GPP metabolism
intensity between the two periods, underlining the positive and significant impact of
the evolution of treatments in the SAV WWTP, as well as in all other smaller plants.
Indeed, between the two periods, the pressure exerted on the lower Seine River by
the Paris conurbation was divided by three. This decrease is in agreement with the
decrease in BOD load (see above) for all the SIAAP WWTPs, as well as with total
phosphorus and ammonium loads from SAV, which were reduced by factors of 3.4
and 4.4, respectively, over the 15-year time span.
4.2 CO 2 Supersaturation in the Seine River: Carbon Sources,
Fate and Budget
Several aquatic carbon sources and processes are in use. Besides in-stream
autotrophy and heterotrophy, inputs of dissolved inorganic carbon (including carbon
dioxide) from the basin contribute to supersaturation of CO 2 in the river with respect
to atmospheric concentrations.
Long-term data from the Water Agency and from the SIAAP allow the reconstruction of partial pressure of CO 2 (pCO 2 ) and of the biodegradable organic
loadings since 1970 [34]. Going back to the 1970s, pCO 2 is estimated given the
-25
-20
-15
-10
-5
0
5
10
15
Suresnes Bougival
Andrésy Méricourt
ER,GPP, gO
2 m -
² d -1
ER 2002-2004
ER 2015-2017
GPP 2002-2004 GPP 2015-2017
-15
-10
-5
0
5
Suresnes Bougival
Andrésy
Méricourt
NEP, gO
2 m -
² d -1
NEP 2002-2004
NEP 2015-2017
b.
a.
Fig. 7 Average intensity of daily metabolism during 2002–2004 and 2015–2017 for the four
stations studied (with Suresnes upstream to Méricourt downstream). GPP, ER (a) and NEP (b) are
in g O 2 m
À2 day
À1
. Metabolism is calculated for a reaeration coefficient k 600 ¼ 2 m/day and a
mixing depth Z mix ¼ 5 m
204
J. Garnier et al.
increases indicate substantial input of allochthonous organic carbon from this highly
populated area, especially downstream of Bougival, and production of autochthonous algal organic carbon.
During the 2015–2017 period, the metabolism intensity still increased from
Suresnes to Andrésy (Fig. 7), even though ER and GPP intensities are three times
lower than during the 2002–2004 period (Fig. 7). However, between Andrésy and
Méricourt, ER and GPP intensities decreased, because allochthonous carbon inputs
had already been mineralised upstream and autochthonous algal biomass had been
reduced.
On average, there is a two- to threefold decrease in ER and GPP metabolism
intensity between the two periods, underlining the positive and significant impact of
the evolution of treatments in the SAV WWTP, as well as in all other smaller plants.
Indeed, between the two periods, the pressure exerted on the lower Seine River by
the Paris conurbation was divided by three. This decrease is in agreement with the
decrease in BOD load (see above) for all the SIAAP WWTPs, as well as with total
phosphorus and ammonium loads from SAV, which were reduced by factors of 3.4
and 4.4, respectively, over the 15-year time span.
4.2 CO 2 Supersaturation in the Seine River: Carbon Sources,
Fate and Budget
Several aquatic carbon sources and processes are in use. Besides in-stream
autotrophy and heterotrophy, inputs of dissolved inorganic carbon (including carbon
dioxide) from the basin contribute to supersaturation of CO 2 in the river with respect
to atmospheric concentrations.
Long-term data from the Water Agency and from the SIAAP allow the reconstruction of partial pressure of CO 2 (pCO 2 ) and of the biodegradable organic
loadings since 1970 [34]. Going back to the 1970s, pCO 2 is estimated given the
-25
-20
-15
-10
-5
0
5
10
15
Suresnes Bougival
Andrésy Méricourt
ER,GPP, gO
2 m -
² d -1
ER 2002-2004
ER 2015-2017
GPP 2002-2004 GPP 2015-2017
-15
-10
-5
0
5
Suresnes Bougival
Andrésy
Méricourt
NEP, gO
2 m -
² d -1
NEP 2002-2004
NEP 2015-2017
b.
a.
Fig. 7 Average intensity of daily metabolism during 2002–2004 and 2015–2017 for the four
stations studied (with Suresnes upstream to Méricourt downstream). GPP, ER (a) and NEP (b) are
in g O 2 m
À2 day
À1
. Metabolism is calculated for a reaeration coefficient k 600 ¼ 2 m/day and a
mixing depth Z mix ¼ 5 m
204
J. Garnier et al.