

demonstrated by the 0.7 correlation coefficient, showing the ability of the model to
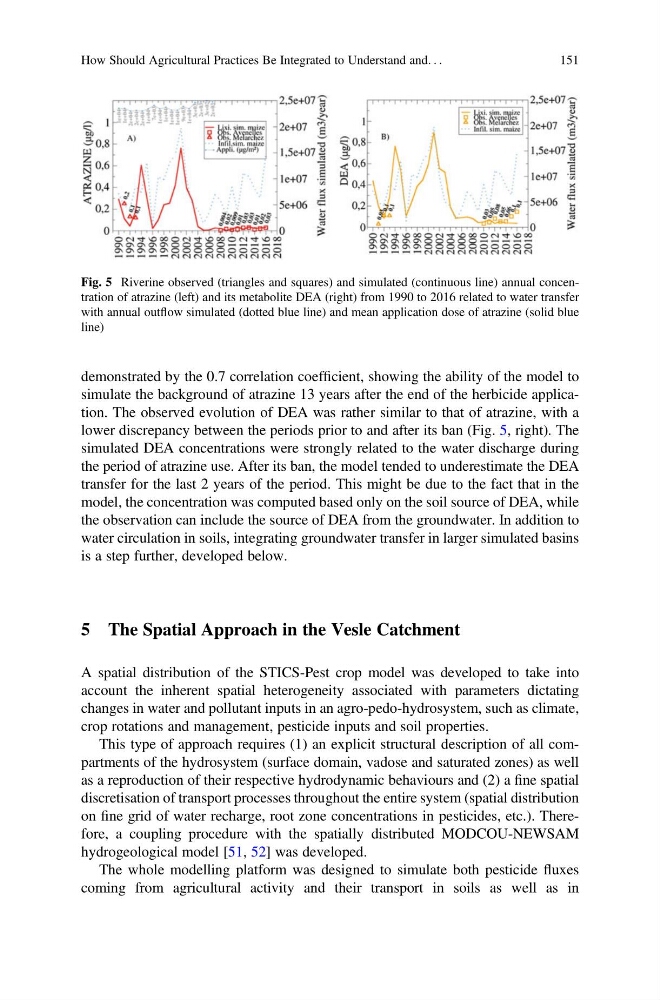
simulate the background of atrazine 13 years after the end of the herbicide application. The observed evolution of DEA was rather similar to that of atrazine, with a
lower discrepancy between the periods prior to and after its ban (Fig. 5, right). The
simulated DEA concentrations were strongly related to the water discharge during
the period of atrazine use. After its ban, the model tended to underestimate the DEA
transfer for the last 2 years of the period. This might be due to the fact that in the
model, the concentration was computed based only on the soil source of DEA, while
the observation can include the source of DEA from the groundwater. In addition to
water circulation in soils, integrating groundwater transfer in larger simulated basins
is a step further, developed below.
5 The Spatial Approach in the Vesle Catchment
A spatial distribution of the STICS-Pest crop model was developed to take into
account the inherent spatial heterogeneity associated with parameters dictating
changes in water and pollutant inputs in an agro-pedo-hydrosystem, such as climate,
crop rotations and management, pesticide inputs and soil properties.
This type of approach requires (1) an explicit structural description of all compartments of the hydrosystem (surface domain, vadose and saturated zones) as well
as a reproduction of their respective hydrodynamic behaviours and (2) a fine spatial
discretisation of transport processes throughout the entire system (spatial distribution
on fine grid of water recharge, root zone concentrations in pesticides, etc.). Therefore, a coupling procedure with the spatially distributed MODCOU-NEWSAM
hydrogeological model [51, 52] was developed.
The whole modelling platform was designed to simulate both pesticide fluxes
coming from agricultural activity and their transport in soils as well as in
Fig. 5 Riverine observed (triangles and squares) and simulated (continuous line) annual concentration of atrazine (left) and its metabolite DEA (right) from 1990 to 2016 related to water transfer
with annual outflow simulated (dotted blue line) and mean application dose of atrazine (solid blue
line)
How Should Agricultural Practices Be Integrated to Understand and. . .
151
simulate the background of atrazine 13 years after the end of the herbicide application. The observed evolution of DEA was rather similar to that of atrazine, with a
lower discrepancy between the periods prior to and after its ban (Fig. 5, right). The
simulated DEA concentrations were strongly related to the water discharge during
the period of atrazine use. After its ban, the model tended to underestimate the DEA
transfer for the last 2 years of the period. This might be due to the fact that in the
model, the concentration was computed based only on the soil source of DEA, while
the observation can include the source of DEA from the groundwater. In addition to
water circulation in soils, integrating groundwater transfer in larger simulated basins
is a step further, developed below.
5 The Spatial Approach in the Vesle Catchment
A spatial distribution of the STICS-Pest crop model was developed to take into
account the inherent spatial heterogeneity associated with parameters dictating
changes in water and pollutant inputs in an agro-pedo-hydrosystem, such as climate,
crop rotations and management, pesticide inputs and soil properties.
This type of approach requires (1) an explicit structural description of all compartments of the hydrosystem (surface domain, vadose and saturated zones) as well
as a reproduction of their respective hydrodynamic behaviours and (2) a fine spatial
discretisation of transport processes throughout the entire system (spatial distribution
on fine grid of water recharge, root zone concentrations in pesticides, etc.). Therefore, a coupling procedure with the spatially distributed MODCOU-NEWSAM
hydrogeological model [51, 52] was developed.
The whole modelling platform was designed to simulate both pesticide fluxes
coming from agricultural activity and their transport in soils as well as in
Fig. 5 Riverine observed (triangles and squares) and simulated (continuous line) annual concentration of atrazine (left) and its metabolite DEA (right) from 1990 to 2016 related to water transfer
with annual outflow simulated (dotted blue line) and mean application dose of atrazine (solid blue
line)
How Should Agricultural Practices Be Integrated to Understand and. . .
151