

similar to the Orgeval catchment [49, 50]. Moreover, the transformation of atrazine
to its metabolite DEA is estimated with the first-order kinetics and maximum
occurrence fraction estimated at 0.21 [48].
Several simplifications and assumptions were made in this study. The soil
characteristics were assumed to be homogeneous at the catchment scale. Given
that more than 80% of the area is artificially drained, we assumed that the residence
time of water is equal to or less than 1 year. Consequently, the simulation and
observed data were compared on an annual scale. Moreover, since we focused on
atrazine behaviour, maize was the only crop considered. Soil water content, organic
matter and nitrogen content were initialised with a 1-year warm-up, while a 14-year
warm-up was used for pesticide initialisation in order to take into account a stock of
atrazine and DEA in the soil at the beginning of the simulation.
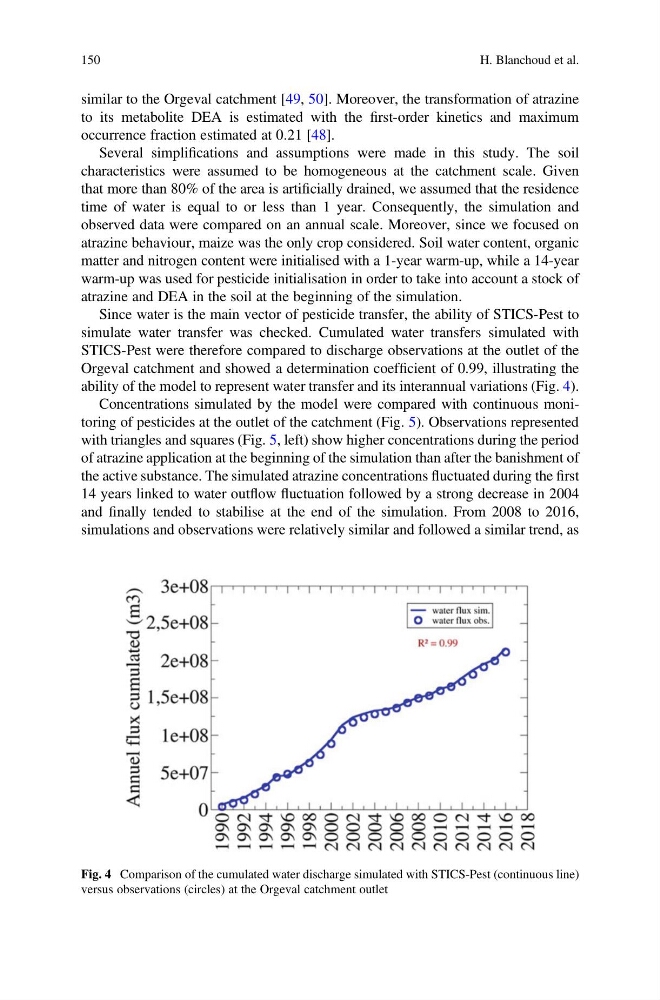
Since water is the main vector of pesticide transfer, the ability of STICS-Pest to
simulate water transfer was checked. Cumulated water transfers simulated with
STICS-Pest were therefore compared to discharge observations at the outlet of the
Orgeval catchment and showed a determination coefficient of 0.99, illustrating the
ability of the model to represent water transfer and its interannual variations (Fig. 4).
Concentrations simulated by the model were compared with continuous monitoring of pesticides at the outlet of the catchment (Fig. 5). Observations represented
with triangles and squares (Fig. 5, left) show higher concentrations during the period
of atrazine application at the beginning of the simulation than after the banishment of
the active substance. The simulated atrazine concentrations fluctuated during the first
14 years linked to water outflow fluctuation followed by a strong decrease in 2004
and finally tended to stabilise at the end of the simulation. From 2008 to 2016,
simulations and observations were relatively similar and followed a similar trend, as
Fig. 4 Comparison of the cumulated water discharge simulated with STICS-Pest (continuous line)
versus observations (circles) at the Orgeval catchment outlet
150
H. Blanchoud et al.
to its metabolite DEA is estimated with the first-order kinetics and maximum
occurrence fraction estimated at 0.21 [48].
Several simplifications and assumptions were made in this study. The soil
characteristics were assumed to be homogeneous at the catchment scale. Given
that more than 80% of the area is artificially drained, we assumed that the residence
time of water is equal to or less than 1 year. Consequently, the simulation and
observed data were compared on an annual scale. Moreover, since we focused on
atrazine behaviour, maize was the only crop considered. Soil water content, organic
matter and nitrogen content were initialised with a 1-year warm-up, while a 14-year
warm-up was used for pesticide initialisation in order to take into account a stock of
atrazine and DEA in the soil at the beginning of the simulation.
Since water is the main vector of pesticide transfer, the ability of STICS-Pest to
simulate water transfer was checked. Cumulated water transfers simulated with
STICS-Pest were therefore compared to discharge observations at the outlet of the
Orgeval catchment and showed a determination coefficient of 0.99, illustrating the
ability of the model to represent water transfer and its interannual variations (Fig. 4).
Concentrations simulated by the model were compared with continuous monitoring of pesticides at the outlet of the catchment (Fig. 5). Observations represented
with triangles and squares (Fig. 5, left) show higher concentrations during the period
of atrazine application at the beginning of the simulation than after the banishment of
the active substance. The simulated atrazine concentrations fluctuated during the first
14 years linked to water outflow fluctuation followed by a strong decrease in 2004
and finally tended to stabilise at the end of the simulation. From 2008 to 2016,
simulations and observations were relatively similar and followed a similar trend, as
Fig. 4 Comparison of the cumulated water discharge simulated with STICS-Pest (continuous line)
versus observations (circles) at the Orgeval catchment outlet
150
H. Blanchoud et al.