

approval. Atrazine and its metabolite DEA were detected in all samples and were
considered as the reference of past contamination for modelling.
To compare the simulations with the observed data, monitoring was adapted.
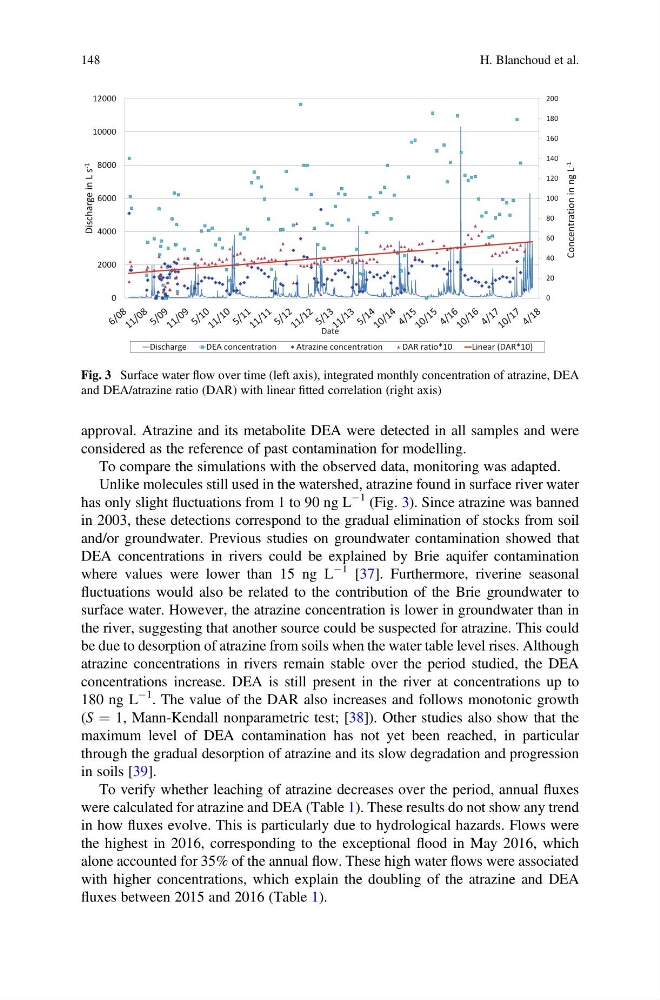
Unlike molecules still used in the watershed, atrazine found in surface river water
has only slight fluctuations from 1 to 90 ng L
À1 (Fig. 3). Since atrazine was banned
in 2003, these detections correspond to the gradual elimination of stocks from soil
and/or groundwater. Previous studies on groundwater contamination showed that
DEA concentrations in rivers could be explained by Brie aquifer contamination
where values were lower than 15 ng L
À1 [37]. Furthermore, riverine seasonal
fluctuations would also be related to the contribution of the Brie groundwater to
surface water. However, the atrazine concentration is lower in groundwater than in
the river, suggesting that another source could be suspected for atrazine. This could
be due to desorption of atrazine from soils when the water table level rises. Although
atrazine concentrations in rivers remain stable over the period studied, the DEA
concentrations increase. DEA is still present in the river at concentrations up to
180 ng L
À1 . The value of the DAR also increases and follows monotonic growth
(S ¼ 1, Mann-Kendall nonparametric test; [38]). Other studies also show that the
maximum level of DEA contamination has not yet been reached, in particular
through the gradual desorption of atrazine and its slow degradation and progression
in soils [39].
To verify whether leaching of atrazine decreases over the period, annual fluxes
were calculated for atrazine and DEA (Table 1). These results do not show any trend
in how fluxes evolve. This is particularly due to hydrological hazards. Flows were
the highest in 2016, corresponding to the exceptional flood in May 2016, which
alone accounted for 35% of the annual flow. These high water flows were associated
with higher concentrations, which explain the doubling of the atrazine and DEA
fluxes between 2015 and 2016 (Table 1).
0
20
40
60
80
100
120
140
160
180
200
0
2000
4000
6000
8000
10000
12000
Concentration in ng L -1
Discharge in L s -1
Date
Discharge
DEA concentration
Atrazine concentration
DAR ratio*10
Linear (DAR*10)
Fig. 3 Surface water flow over time (left axis), integrated monthly concentration of atrazine, DEA
and DEA/atrazine ratio (DAR) with linear fitted correlation (right axis)
148
H. Blanchoud et al.
considered as the reference of past contamination for modelling.
To compare the simulations with the observed data, monitoring was adapted.
Unlike molecules still used in the watershed, atrazine found in surface river water
has only slight fluctuations from 1 to 90 ng L
À1 (Fig. 3). Since atrazine was banned
in 2003, these detections correspond to the gradual elimination of stocks from soil
and/or groundwater. Previous studies on groundwater contamination showed that
DEA concentrations in rivers could be explained by Brie aquifer contamination
where values were lower than 15 ng L
À1 [37]. Furthermore, riverine seasonal
fluctuations would also be related to the contribution of the Brie groundwater to
surface water. However, the atrazine concentration is lower in groundwater than in
the river, suggesting that another source could be suspected for atrazine. This could
be due to desorption of atrazine from soils when the water table level rises. Although
atrazine concentrations in rivers remain stable over the period studied, the DEA
concentrations increase. DEA is still present in the river at concentrations up to
180 ng L
À1 . The value of the DAR also increases and follows monotonic growth
(S ¼ 1, Mann-Kendall nonparametric test; [38]). Other studies also show that the
maximum level of DEA contamination has not yet been reached, in particular
through the gradual desorption of atrazine and its slow degradation and progression
in soils [39].
To verify whether leaching of atrazine decreases over the period, annual fluxes
were calculated for atrazine and DEA (Table 1). These results do not show any trend
in how fluxes evolve. This is particularly due to hydrological hazards. Flows were
the highest in 2016, corresponding to the exceptional flood in May 2016, which
alone accounted for 35% of the annual flow. These high water flows were associated
with higher concentrations, which explain the doubling of the atrazine and DEA
fluxes between 2015 and 2016 (Table 1).
0
20
40
60
80
100
120
140
160
180
200
0
2000
4000
6000
8000
10000
12000
Concentration in ng L -1
Discharge in L s -1
Date
Discharge
DEA concentration
Atrazine concentration
DAR ratio*10
Linear (DAR*10)
Fig. 3 Surface water flow over time (left axis), integrated monthly concentration of atrazine, DEA
and DEA/atrazine ratio (DAR) with linear fitted correlation (right axis)
148
H. Blanchoud et al.