

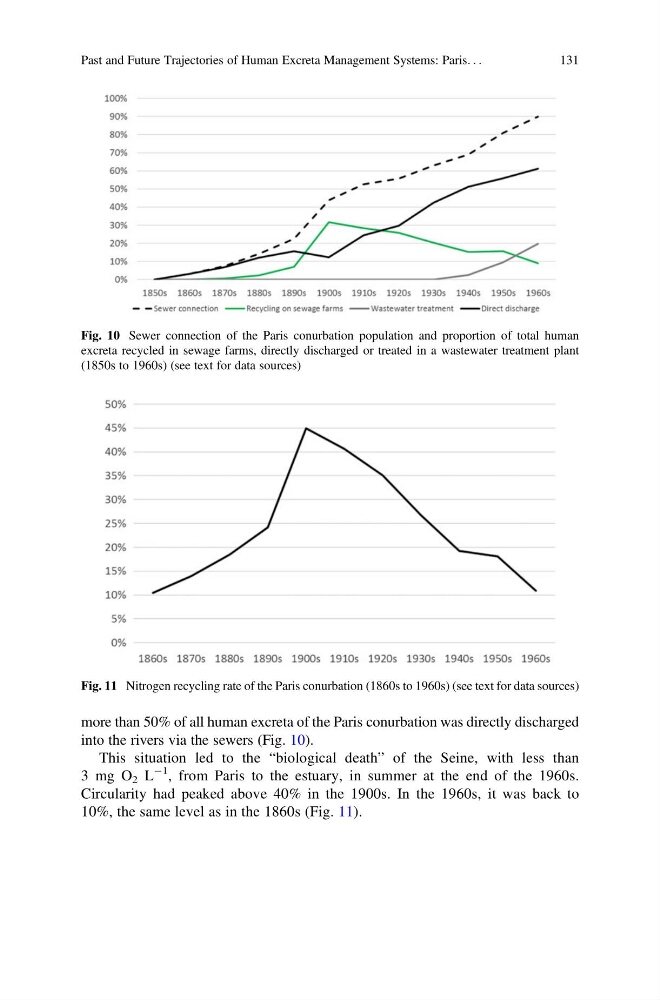
more than 50% of all human excreta of the Paris conurbation was directly discharged
into the rivers via the sewers (Fig. 10).
This situation led to the “biological death” of the Seine, with less than
3 mg O 2 L
À1 , from Paris to the estuary, in summer at the end of the 1960s.
Circularity had peaked above 40% in the 1900s. In the 1960s, it was back to
10%, the same level as in the 1860s (Fig. 11).
Fig. 10 Sewer connection of the Paris conurbation population and proportion of total human
excreta recycled in sewage farms, directly discharged or treated in a wastewater treatment plant
(1850s to 1960s) (see text for data sources)
Fig. 11 Nitrogen recycling rate of the Paris conurbation (1860s to 1960s) (see text for data sources)
Past and Future Trajectories of Human Excreta Management Systems: Paris. . .
131
into the rivers via the sewers (Fig. 10).
This situation led to the “biological death” of the Seine, with less than
3 mg O 2 L
À1 , from Paris to the estuary, in summer at the end of the 1960s.
Circularity had peaked above 40% in the 1900s. In the 1960s, it was back to
10%, the same level as in the 1860s (Fig. 11).
Fig. 10 Sewer connection of the Paris conurbation population and proportion of total human
excreta recycled in sewage farms, directly discharged or treated in a wastewater treatment plant
(1850s to 1960s) (see text for data sources)
Fig. 11 Nitrogen recycling rate of the Paris conurbation (1860s to 1960s) (see text for data sources)
Past and Future Trajectories of Human Excreta Management Systems: Paris. . .
131