

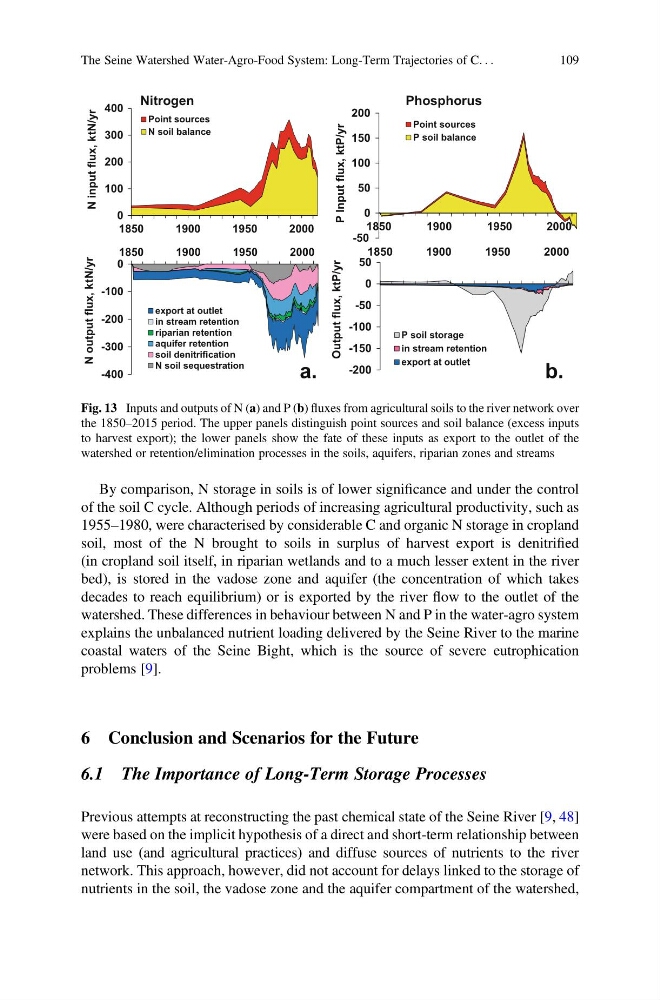
By comparison, N storage in soils is of lower significance and under the control
of the soil C cycle. Although periods of increasing agricultural productivity, such as
1955–1980, were characterised by considerable C and organic N storage in cropland
soil, most of the N brought to soils in surplus of harvest export is denitrified
(in cropland soil itself, in riparian wetlands and to a much lesser extent in the river
bed), is stored in the vadose zone and aquifer (the concentration of which takes
decades to reach equilibrium) or is exported by the river flow to the outlet of the
watershed. These differences in behaviour between N and P in the water-agro system
explains the unbalanced nutrient loading delivered by the Seine River to the marine
coastal waters of the Seine Bight, which is the source of severe eutrophication
problems [9].
6 Conclusion and Scenarios for the Future
6.1 The Importance of Long-Term Storage Processes
Previous attempts at reconstructing the past chemical state of the Seine River [9, 48]
were based on the implicit hypothesis of a direct and short-term relationship between
land use (and agricultural practices) and diffuse sources of nutrients to the river
network. This approach, however, did not account for delays linked to the storage of
nutrients in the soil, the vadose zone and the aquifer compartment of the watershed,
-400
-300
-200
-100
0
1850
1900
1950
2000
r
y
/
N
t
k
,
x
u
l
f
t
u
p
t
u
o
N
export at outlet
in stream retention
riparian retention
aquifer retention
soil denitrification
N soil sequestration
-50
0
50
100
150
200
1850
1900
1950
2000
r
y
/
P
t
k
,
x
u
l
f
t
u
p
n
I
P
Point sources
P soil balance
-200
-150
-100
-50
0
50
1850
1900
1950
2000
r
y
/
P
t
k
,
x
u
l
f
t
u
p
t
u
O
P soil storage
in stream retention
export at outlet
Phosphorus
b.
0
100
200
300
400
1850
1900
1950
2000
r
y
/
N
t
k
,
x
u
l
f
t
u
p
n
i
N
Point sources
N soil balance
Nitrogen
a.
Fig. 13 Inputs and outputs of N (a) and P (b) fluxes from agricultural soils to the river network over
the 1850–2015 period. The upper panels distinguish point sources and soil balance (excess inputs
to harvest export); the lower panels show the fate of these inputs as export to the outlet of the
watershed or retention/elimination processes in the soils, aquifers, riparian zones and streams
The Seine Watershed Water-Agro-Food System: Long-Term Trajectories of C. . .
109
of the soil C cycle. Although periods of increasing agricultural productivity, such as
1955–1980, were characterised by considerable C and organic N storage in cropland
soil, most of the N brought to soils in surplus of harvest export is denitrified
(in cropland soil itself, in riparian wetlands and to a much lesser extent in the river
bed), is stored in the vadose zone and aquifer (the concentration of which takes
decades to reach equilibrium) or is exported by the river flow to the outlet of the
watershed. These differences in behaviour between N and P in the water-agro system
explains the unbalanced nutrient loading delivered by the Seine River to the marine
coastal waters of the Seine Bight, which is the source of severe eutrophication
problems [9].
6 Conclusion and Scenarios for the Future
6.1 The Importance of Long-Term Storage Processes
Previous attempts at reconstructing the past chemical state of the Seine River [9, 48]
were based on the implicit hypothesis of a direct and short-term relationship between
land use (and agricultural practices) and diffuse sources of nutrients to the river
network. This approach, however, did not account for delays linked to the storage of
nutrients in the soil, the vadose zone and the aquifer compartment of the watershed,
-400
-300
-200
-100
0
1850
1900
1950
2000
r
y
/
N
t
k
,
x
u
l
f
t
u
p
t
u
o
N
export at outlet
in stream retention
riparian retention
aquifer retention
soil denitrification
N soil sequestration
-50
0
50
100
150
200
1850
1900
1950
2000
r
y
/
P
t
k
,
x
u
l
f
t
u
p
n
I
P
Point sources
P soil balance
-200
-150
-100
-50
0
50
1850
1900
1950
2000
r
y
/
P
t
k
,
x
u
l
f
t
u
p
t
u
O
P soil storage
in stream retention
export at outlet
Phosphorus
b.
0
100
200
300
400
1850
1900
1950
2000
r
y
/
N
t
k
,
x
u
l
f
t
u
p
n
i
N
Point sources
N soil balance
Nitrogen
a.
Fig. 13 Inputs and outputs of N (a) and P (b) fluxes from agricultural soils to the river network over
the 1850–2015 period. The upper panels distinguish point sources and soil balance (excess inputs
to harvest export); the lower panels show the fate of these inputs as export to the outlet of the
watershed or retention/elimination processes in the soils, aquifers, riparian zones and streams
The Seine Watershed Water-Agro-Food System: Long-Term Trajectories of C. . .
109