

as already discussed by Thieu et al. [49]. In view of the length of these delays,
considering long-term historical variations of agriculture is required for correctly
understanding soil and water quality: many characteristics of these systems are
inherited from past trajectories of agricultural systems. This is particularly true for
pools of C and nutrients accumulated in the soil, as well as for nitrate (and pesticides)
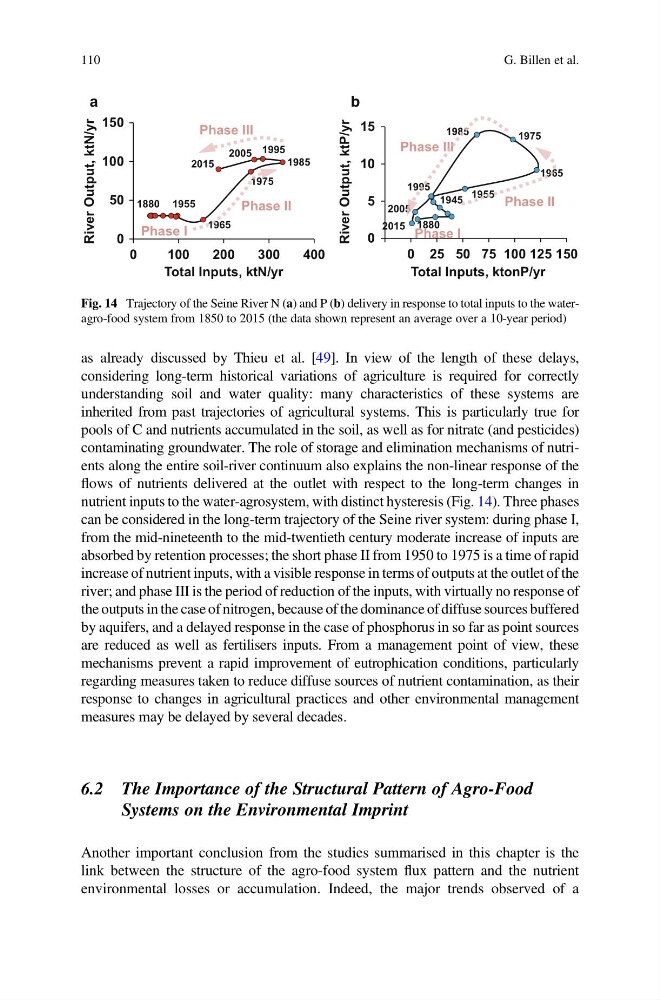
contaminating groundwater. The role of storage and elimination mechanisms of nutrients along the entire soil-river continuum also explains the non-linear response of the
flows of nutrients delivered at the outlet with respect to the long-term changes in
nutrient inputs to the water-agrosystem, with distinct hysteresis (Fig. 14). Three phases
can be considered in the long-term trajectory of the Seine river system: during phase I,
from the mid-nineteenth to the mid-twentieth century moderate increase of inputs are
absorbed by retention processes; the short phase II from 1950 to 1975 is a time of rapid
increase of nutrient inputs, with a visible response in terms of outputs at the outlet of the
river; and phase III is the period of reduction of the inputs, with virtually no response of
the outputs in the case of nitrogen, because of the dominance of diffuse sources buffered
by aquifers, and a delayed response in the case of phosphorus in so far as point sources
are reduced as well as fertilisers inputs. From a management point of view, these
mechanisms prevent a rapid improvement of eutrophication conditions, particularly
regarding measures taken to reduce diffuse sources of nutrient contamination, as their
response to changes in agricultural practices and other environmental management
measures may be delayed by several decades.
6.2 The Importance of the Structural Pattern of Agro-Food
Systems on the Environmental Imprint
Another important conclusion from the studies summarised in this chapter is the
link between the structure of the agro-food system flux pattern and the nutrient
environmental losses or accumulation. Indeed, the major trends observed of a
0
50
100
150
0
100
200
300
400
r
y
/
N
t
k
,
t
u
p
t
u
O
r
e
v
i
R
Total Inputs, ktN/yr
2015
2005
1985
1995
1975
1965
1955
1880
0
5
10
15
0 25 50 75 100 125 150
River Output, ktP/yr
Total Inputs, ktonP/yr
2005
1995
1985
1975
1965
1955
1945
2015 1880
1
19
1 1 7
Phase II
Phase I
Phase III
Phase I
Phase II
Phase III
5
9 95
85 5
II
196
955
5
a
b
Fig. 14 Trajectory of the Seine River N (a) and P (b) delivery in response to total inputs to the wateragro-food system from 1850 to 2015 (the data shown represent an average over a 10-year period)
110
G. Billen et al.
considering long-term historical variations of agriculture is required for correctly
understanding soil and water quality: many characteristics of these systems are
inherited from past trajectories of agricultural systems. This is particularly true for
pools of C and nutrients accumulated in the soil, as well as for nitrate (and pesticides)
contaminating groundwater. The role of storage and elimination mechanisms of nutrients along the entire soil-river continuum also explains the non-linear response of the
flows of nutrients delivered at the outlet with respect to the long-term changes in
nutrient inputs to the water-agrosystem, with distinct hysteresis (Fig. 14). Three phases
can be considered in the long-term trajectory of the Seine river system: during phase I,
from the mid-nineteenth to the mid-twentieth century moderate increase of inputs are
absorbed by retention processes; the short phase II from 1950 to 1975 is a time of rapid
increase of nutrient inputs, with a visible response in terms of outputs at the outlet of the
river; and phase III is the period of reduction of the inputs, with virtually no response of
the outputs in the case of nitrogen, because of the dominance of diffuse sources buffered
by aquifers, and a delayed response in the case of phosphorus in so far as point sources
are reduced as well as fertilisers inputs. From a management point of view, these
mechanisms prevent a rapid improvement of eutrophication conditions, particularly
regarding measures taken to reduce diffuse sources of nutrient contamination, as their
response to changes in agricultural practices and other environmental management
measures may be delayed by several decades.
6.2 The Importance of the Structural Pattern of Agro-Food
Systems on the Environmental Imprint
Another important conclusion from the studies summarised in this chapter is the
link between the structure of the agro-food system flux pattern and the nutrient
environmental losses or accumulation. Indeed, the major trends observed of a
0
50
100
150
0
100
200
300
400
r
y
/
N
t
k
,
t
u
p
t
u
O
r
e
v
i
R
Total Inputs, ktN/yr
2015
2005
1985
1995
1975
1965
1955
1880
0
5
10
15
0 25 50 75 100 125 150
River Output, ktP/yr
Total Inputs, ktonP/yr
2005
1995
1985
1975
1965
1955
1945
2015 1880
1
19
1 1 7
Phase II
Phase I
Phase III
Phase I
Phase II
Phase III
5
9 95
85 5
II
196
955
5
a
b
Fig. 14 Trajectory of the Seine River N (a) and P (b) delivery in response to total inputs to the wateragro-food system from 1850 to 2015 (the data shown represent an average over a 10-year period)
110
G. Billen et al.