

7
others showed that adsorption rates generally increase with decrease in the particle
size of activated carbon and an increase in its mesopore volume.
Pretreatment is followed with the activation process which can be accomplished
by either physical or chemical treatments (Alslaibi et al. 2013). The former involves
a two-step process of carbonization at high temperatures of between 600 and 900 °C
(Ioannidou and Zabaniotou 2007) followed by steam or CO 2 activation, while the
precursor is first impregnated by an activating agent such as NaOH or ZnCl 2 and
then followed by carbonization at a relatively lower temperatures of between 300
and 700 °C (Giraldo and Moreno-Piraján 2012) in the chemical activation treatment
(Yahya et al. 2015). Activation helps to develop initial porosity by dehydration and
degradation of the biomass structure (González-García 2018). Features of the two
activation methods are illustrated in Table 1.3.
Recently, research efforts have shifted to carrying out the carbonization process
in microwave rather than in conventional furnace as this has been reported to consume less energy and requires lower carbonization temperature and duration
(Alslaibi et al. 2013). Above all, it results in the development of activated carbon
with higher surface area and mesopore volume (Hesas et al. 2013).
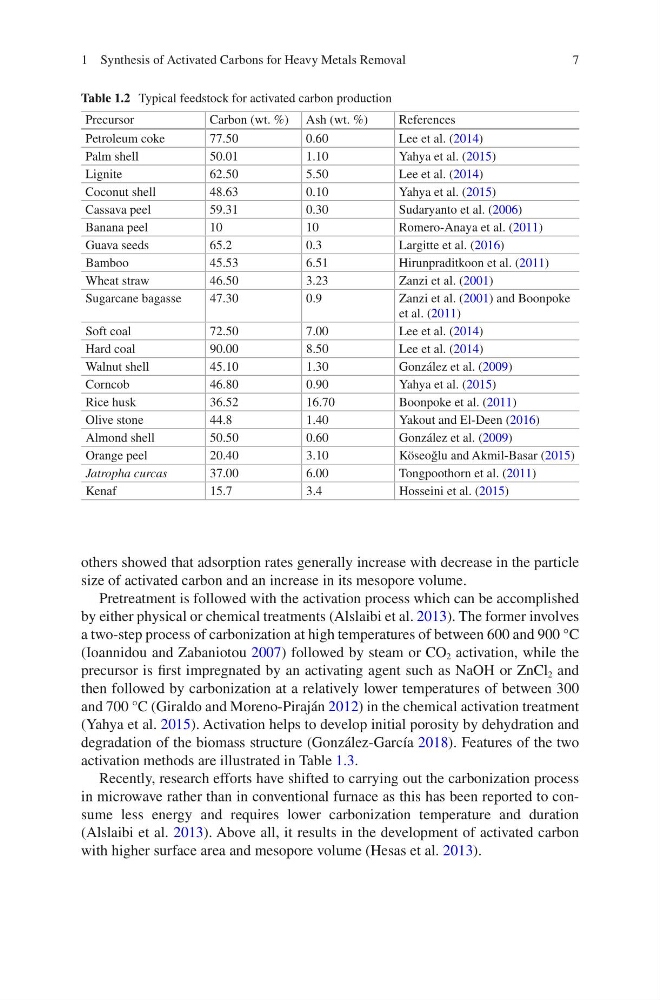
Table 1.2 Typical feedstock for activated carbon production
Precursor
Carbon (wt. %) Ash (wt. %)
References
Petroleum coke
77.50
0.60
Lee et al. (2014)
Palm shell
50.01
1.10
Yahya et al. (2015)
Lignite
62.50
5.50
Lee et al. (2014)
Coconut shell
48.63
0.10
Yahya et al. (2015)
Cassava peel
59.31
0.30
Sudaryanto et al. (2006)
Banana peel
10
10
Romero-Anaya et al. (2011)
Guava seeds
65.2
0.3
Largitte et al. (2016)
Bamboo
45.53
6.51
Hirunpraditkoon et al. (2011)
Wheat straw
46.50
3.23
Zanzi et al. (2001)
Sugarcane bagasse
47.30
0.9
Zanzi et al. (2001) and Boonpoke
et al. (2011)
Soft coal
72.50
7.00
Lee et al. (2014)
Hard coal
90.00
8.50
Lee et al. (2014)
Walnut shell
45.10
1.30
González et al. (2009)
Corncob
46.80
0.90
Yahya et al. (2015)
Rice husk
36.52
16.70
Boonpoke et al. (2011)
Olive stone
44.8
1.40
Yakout and El-Deen (2016)
Almond shell
50.50
0.60
González et al. (2009)
Orange peel
20.40
3.10
Köseoğlu and Akmil-Basar (2015)
Jatropha curcas
37.00
6.00
Tongpoothorn et al. (2011)
Kenaf
15.7
3.4
Hosseini et al. (2015)
1 Synthesis of Activated Carbons for Heavy Metals Removal
others showed that adsorption rates generally increase with decrease in the particle
size of activated carbon and an increase in its mesopore volume.
Pretreatment is followed with the activation process which can be accomplished
by either physical or chemical treatments (Alslaibi et al. 2013). The former involves
a two-step process of carbonization at high temperatures of between 600 and 900 °C
(Ioannidou and Zabaniotou 2007) followed by steam or CO 2 activation, while the
precursor is first impregnated by an activating agent such as NaOH or ZnCl 2 and
then followed by carbonization at a relatively lower temperatures of between 300
and 700 °C (Giraldo and Moreno-Piraján 2012) in the chemical activation treatment
(Yahya et al. 2015). Activation helps to develop initial porosity by dehydration and
degradation of the biomass structure (González-García 2018). Features of the two
activation methods are illustrated in Table 1.3.
Recently, research efforts have shifted to carrying out the carbonization process
in microwave rather than in conventional furnace as this has been reported to consume less energy and requires lower carbonization temperature and duration
(Alslaibi et al. 2013). Above all, it results in the development of activated carbon
with higher surface area and mesopore volume (Hesas et al. 2013).
Table 1.2 Typical feedstock for activated carbon production
Precursor
Carbon (wt. %) Ash (wt. %)
References
Petroleum coke
77.50
0.60
Lee et al. (2014)
Palm shell
50.01
1.10
Yahya et al. (2015)
Lignite
62.50
5.50
Lee et al. (2014)
Coconut shell
48.63
0.10
Yahya et al. (2015)
Cassava peel
59.31
0.30
Sudaryanto et al. (2006)
Banana peel
10
10
Romero-Anaya et al. (2011)
Guava seeds
65.2
0.3
Largitte et al. (2016)
Bamboo
45.53
6.51
Hirunpraditkoon et al. (2011)
Wheat straw
46.50
3.23
Zanzi et al. (2001)
Sugarcane bagasse
47.30
0.9
Zanzi et al. (2001) and Boonpoke
et al. (2011)
Soft coal
72.50
7.00
Lee et al. (2014)
Hard coal
90.00
8.50
Lee et al. (2014)
Walnut shell
45.10
1.30
González et al. (2009)
Corncob
46.80
0.90
Yahya et al. (2015)
Rice husk
36.52
16.70
Boonpoke et al. (2011)
Olive stone
44.8
1.40
Yakout and El-Deen (2016)
Almond shell
50.50
0.60
González et al. (2009)
Orange peel
20.40
3.10
Köseoğlu and Akmil-Basar (2015)
Jatropha curcas
37.00
6.00
Tongpoothorn et al. (2011)
Kenaf
15.7
3.4
Hosseini et al. (2015)
1 Synthesis of Activated Carbons for Heavy Metals Removal