

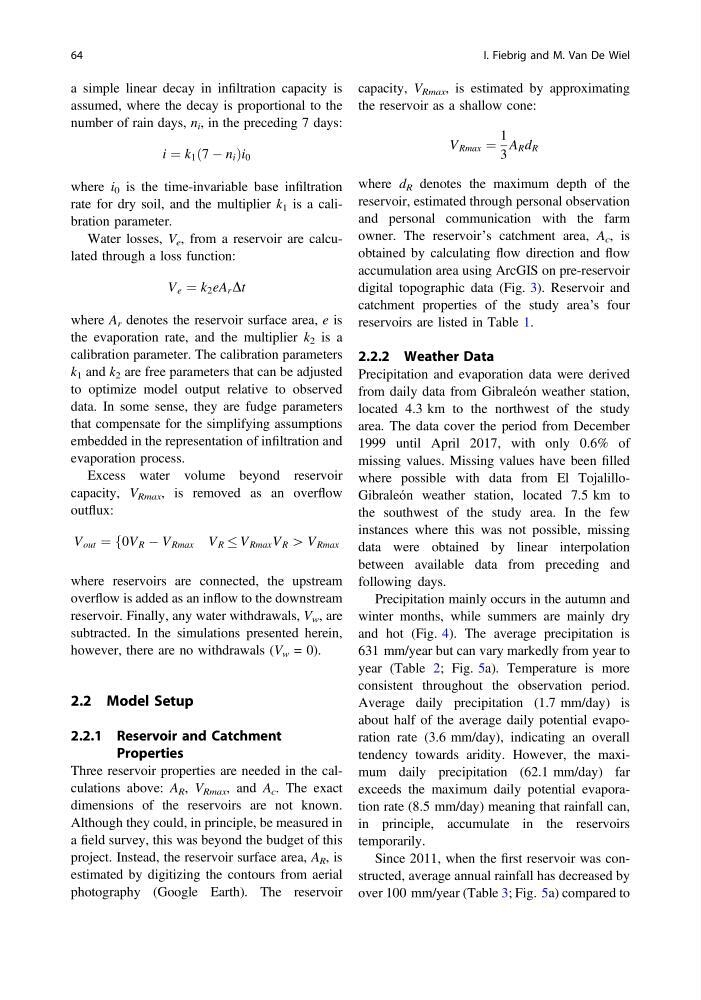
a simple linear decay in infiltration capacity is
assumed, where the decay is proportional to the
number of rain days, n i , in the preceding 7 days:
i ¼ k 1 7 À n i
ð
Þi 0
where i 0 is the time-invariable base infiltration
rate for dry soil, and the multiplier k 1 is a calibration parameter.
Water losses, V e , from a reservoir are calculated through a loss function:
V e ¼ k 2 eA r Dt
where A r denotes the reservoir surface area, e is
the evaporation rate, and the multiplier k 2 is a
calibration parameter. The calibration parameters
k 1 and k 2 are free parameters that can be adjusted
to optimize model output relative to observed
data. In some sense, they are fudge parameters
that compensate for the simplifying assumptions
embedded in the representation of infiltration and
evaporation process.
Excess water volume beyond reservoir
capacity, V Rmax , is removed as an overflow
outflux:
V out ¼ f0V R À V Rmax V R V Rmax V R [ V Rmax
where reservoirs are connected, the upstream
overflow is added as an inflow to the downstream
reservoir. Finally, any water withdrawals, V w , are
subtracted. In the simulations presented herein,
however, there are no withdrawals (V w = 0).
2.2 Model Setup
2.2.1 Reservoir and Catchment
Properties
Three reservoir properties are needed in the calculations above: A R , V Rmax , and A c . The exact
dimensions of the reservoirs are not known.
Although they could, in principle, be measured in
a field survey, this was beyond the budget of this
project. Instead, the reservoir surface area, A R , is
estimated by digitizing the contours from aerial
photography (Google Earth). The reservoir
capacity, V Rmax , is estimated by approximating
the reservoir as a shallow cone:
V Rmax ¼
1
3
A R d R
where d R denotes the maximum depth of the
reservoir, estimated through personal observation
and personal communication with the farm
owner. The reservoir’s catchment area, A c , is
obtained by calculating flow direction and flow
accumulation area using ArcGIS on pre-reservoir
digital topographic data (Fig. 3). Reservoir and
catchment properties of the study area’s four
reservoirs are listed in Table 1.
2.2.2 Weather Data
Precipitation and evaporation data were derived
from daily data from Gibraleón weather station,
located 4.3 km to the northwest of the study
area. The data cover the period from December
1999 until April 2017, with only 0.6% of
missing values. Missing values have been filled
where possible with data from El TojalilloGibraleón weather station, located 7.5 km to
the southwest of the study area. In the few
instances where this was not possible, missing
data were obtained by linear interpolation
between available data from preceding and
following days.
Precipitation mainly occurs in the autumn and
winter months, while summers are mainly dry
and hot (Fig. 4). The average precipitation is
631 mm/year but can vary markedly from year to
year (Table 2; Fig. 5a). Temperature is more
consistent throughout the observation period.
Average daily precipitation (1.7 mm/day) is
about half of the average daily potential evaporation rate (3.6 mm/day), indicating an overall
tendency towards aridity. However, the maximum daily precipitation (62.1 mm/day) far
exceeds the maximum daily potential evaporation rate (8.5 mm/day) meaning that rainfall can,
in principle, accumulate in the reservoirs
temporarily.
Since 2011, when the first reservoir was constructed, average annual rainfall has decreased by
over 100 mm/year (Table 3; Fig. 5a) compared to
64
I. Fiebrig and M. Van De Wiel
assumed, where the decay is proportional to the
number of rain days, n i , in the preceding 7 days:
i ¼ k 1 7 À n i
ð
Þi 0
where i 0 is the time-invariable base infiltration
rate for dry soil, and the multiplier k 1 is a calibration parameter.
Water losses, V e , from a reservoir are calculated through a loss function:
V e ¼ k 2 eA r Dt
where A r denotes the reservoir surface area, e is
the evaporation rate, and the multiplier k 2 is a
calibration parameter. The calibration parameters
k 1 and k 2 are free parameters that can be adjusted
to optimize model output relative to observed
data. In some sense, they are fudge parameters
that compensate for the simplifying assumptions
embedded in the representation of infiltration and
evaporation process.
Excess water volume beyond reservoir
capacity, V Rmax , is removed as an overflow
outflux:
V out ¼ f0V R À V Rmax V R V Rmax V R [ V Rmax
where reservoirs are connected, the upstream
overflow is added as an inflow to the downstream
reservoir. Finally, any water withdrawals, V w , are
subtracted. In the simulations presented herein,
however, there are no withdrawals (V w = 0).
2.2 Model Setup
2.2.1 Reservoir and Catchment
Properties
Three reservoir properties are needed in the calculations above: A R , V Rmax , and A c . The exact
dimensions of the reservoirs are not known.
Although they could, in principle, be measured in
a field survey, this was beyond the budget of this
project. Instead, the reservoir surface area, A R , is
estimated by digitizing the contours from aerial
photography (Google Earth). The reservoir
capacity, V Rmax , is estimated by approximating
the reservoir as a shallow cone:
V Rmax ¼
1
3
A R d R
where d R denotes the maximum depth of the
reservoir, estimated through personal observation
and personal communication with the farm
owner. The reservoir’s catchment area, A c , is
obtained by calculating flow direction and flow
accumulation area using ArcGIS on pre-reservoir
digital topographic data (Fig. 3). Reservoir and
catchment properties of the study area’s four
reservoirs are listed in Table 1.
2.2.2 Weather Data
Precipitation and evaporation data were derived
from daily data from Gibraleón weather station,
located 4.3 km to the northwest of the study
area. The data cover the period from December
1999 until April 2017, with only 0.6% of
missing values. Missing values have been filled
where possible with data from El TojalilloGibraleón weather station, located 7.5 km to
the southwest of the study area. In the few
instances where this was not possible, missing
data were obtained by linear interpolation
between available data from preceding and
following days.
Precipitation mainly occurs in the autumn and
winter months, while summers are mainly dry
and hot (Fig. 4). The average precipitation is
631 mm/year but can vary markedly from year to
year (Table 2; Fig. 5a). Temperature is more
consistent throughout the observation period.
Average daily precipitation (1.7 mm/day) is
about half of the average daily potential evaporation rate (3.6 mm/day), indicating an overall
tendency towards aridity. However, the maximum daily precipitation (62.1 mm/day) far
exceeds the maximum daily potential evaporation rate (8.5 mm/day) meaning that rainfall can,
in principle, accumulate in the reservoirs
temporarily.
Since 2011, when the first reservoir was constructed, average annual rainfall has decreased by
over 100 mm/year (Table 3; Fig. 5a) compared to
64
I. Fiebrig and M. Van De Wiel