

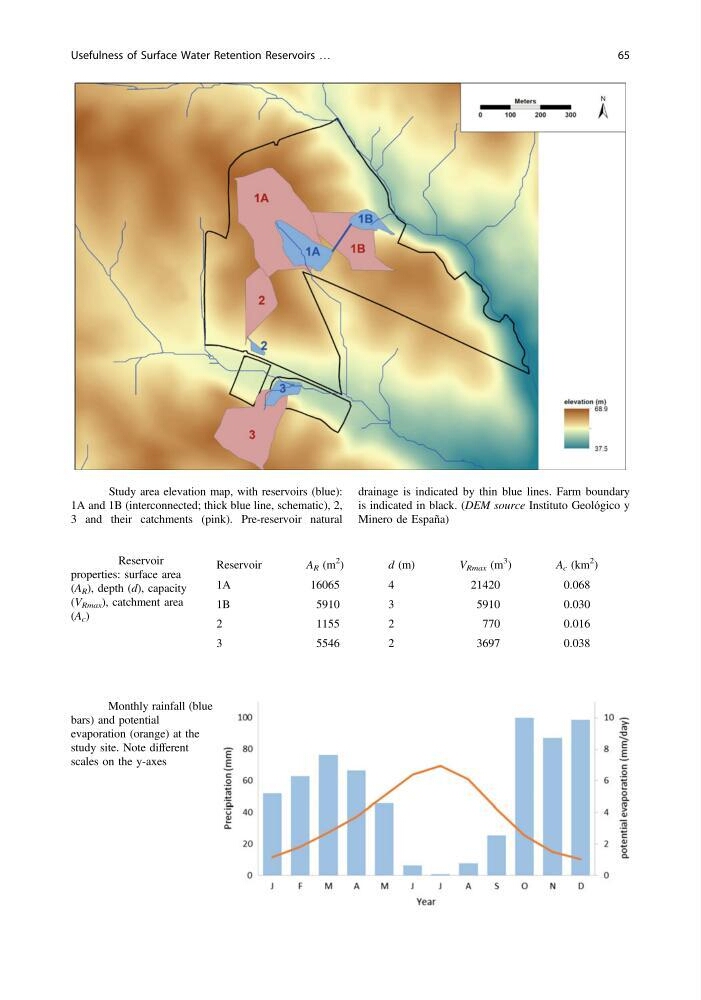
Fig. 3 Study area elevation map, with reservoirs (blue):
1A and 1B (interconnected; thick blue line, schematic), 2,
3 and their catchments (pink). Pre-reservoir natural
drainage is indicated by thin blue lines. Farm boundary
is indicated in black. (DEM source Instituto Geológico y
Minero de España)
Table 1 Reservoir
properties: surface area
(A R ), depth (d), capacity
(V Rmax ), catchment area
(A c )
Reservoir
A R (m
2
)
d (m)
V Rmax (m
3
)
A c (km
2
)
1A
16065
4
21420
0.068
1B
5910
3
5910
0.030
2
1155
2
770
0.016
3
5546
2
3697
0.038
Fig. 4 Monthly rainfall (blue
bars) and potential
evaporation (orange) at the
study site. Note different
scales on the y-axes
Usefulness of Surface Water Retention Reservoirs …
65
1A and 1B (interconnected; thick blue line, schematic), 2,
3 and their catchments (pink). Pre-reservoir natural
drainage is indicated by thin blue lines. Farm boundary
is indicated in black. (DEM source Instituto Geológico y
Minero de España)
Table 1 Reservoir
properties: surface area
(A R ), depth (d), capacity
(V Rmax ), catchment area
(A c )
Reservoir
A R (m
2
)
d (m)
V Rmax (m
3
)
A c (km
2
)
1A
16065
4
21420
0.068
1B
5910
3
5910
0.030
2
1155
2
770
0.016
3
5546
2
3697
0.038
Fig. 4 Monthly rainfall (blue
bars) and potential
evaporation (orange) at the
study site. Note different
scales on the y-axes
Usefulness of Surface Water Retention Reservoirs …
65