

changed continuously, establishing one or two
periods of higher pricing during the day. In fact,
these changes seek to segment the demand for
targeted pricing as exposed in Table 3. However,
as pointed out by Severino (2005), these time
slots do not correspond with the national energy
market that provides local distributors.
There is a strong relationship between subsidy
and energy tariffs. During 2012, energy subsidies
reached up to 57 and 79% of the total energy
tariffs for groundwater pumping in high-demand
periods and low-demand periods, respectively.
On a yearly basis, the provincial energy regulator
(EPRE) seeks to improve policy targeting by
visiting beneficiaries randomly and checking
their subsidy qualification. This action has contributed to improving the policy targeting by
decreasing the list of beneficiaries by 10%.
Normally, the subsidized power for agriculture
irrigation is near 4 MWh per year, from which
20% is estimated as loss from inefficiency due to
improper pumping equipment (Severino 2016).
Although the real cost of providing energy
has changed over time, the subsidy rate has
remained untouched. In 2015, the new national
administration announced the lowering the
subsidy share of energy tariffs. Nevertheless,
agricultural beneficiaries continued to receive
the subsidy provided by the province, where the
total amount of subsidy budget increased to USD
1.89 million, representing a 55% increase.
Attempts to withdraw the energy subsidies for
agricultural irrigation have not been successful
in the past.
Currency devaluation started in 2002 and
followed with adjustments in the valuation of the
Argentinean peso over a decade. This implied
local adjustments in the energy prices despite
government support as shown in Fig. 5, where
prices for (A) high-demand and (B) low-demand
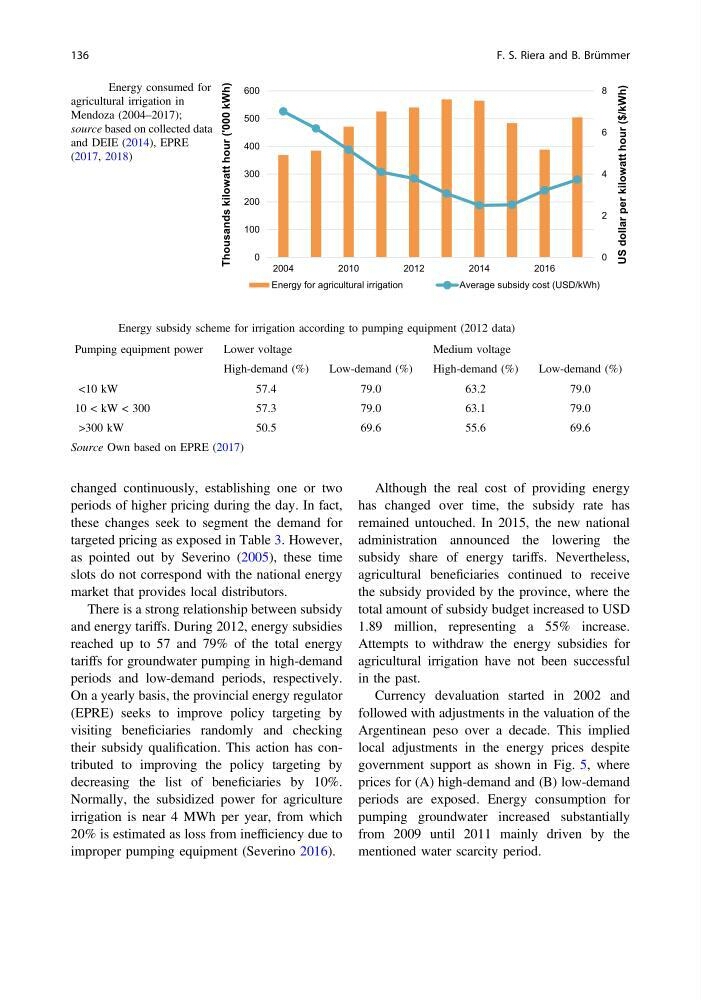
periods are exposed. Energy consumption for
pumping groundwater increased substantially
from 2009 until 2011 mainly driven by the
mentioned water scarcity period.
0
2
4
6
8
0
100
200
300
400
500
600
2004
2010
2012
2014
2016
US dollar per kilowatt hour ($/kWh)
Thousands kilowatt hour ('000 kWh)
Energy for agricultural irrigation
Average subsidy cost (USD/kWh)
Fig. 4 Energy consumed for
agricultural irrigation in
Mendoza (2004–2017);
source based on collected data
and DEIE (2014), EPRE
(2017, 2018)
Table 3 Energy subsidy scheme for irrigation according to pumping equipment (2012 data)
Pumping equipment power
Lower voltage
Medium voltage
High-demand (%)
Low-demand (%)
High-demand (%)
Low-demand (%)
<10 kW
57.4
79.0
63.2
79.0
10 < kW < 300
57.3
79.0
63.1
79.0
>300 kW
50.5
69.6
55.6
69.6
Source Own based on EPRE (2017)
136
F. S. Riera and B. Brümmer
periods of higher pricing during the day. In fact,
these changes seek to segment the demand for
targeted pricing as exposed in Table 3. However,
as pointed out by Severino (2005), these time
slots do not correspond with the national energy
market that provides local distributors.
There is a strong relationship between subsidy
and energy tariffs. During 2012, energy subsidies
reached up to 57 and 79% of the total energy
tariffs for groundwater pumping in high-demand
periods and low-demand periods, respectively.
On a yearly basis, the provincial energy regulator
(EPRE) seeks to improve policy targeting by
visiting beneficiaries randomly and checking
their subsidy qualification. This action has contributed to improving the policy targeting by
decreasing the list of beneficiaries by 10%.
Normally, the subsidized power for agriculture
irrigation is near 4 MWh per year, from which
20% is estimated as loss from inefficiency due to
improper pumping equipment (Severino 2016).
Although the real cost of providing energy
has changed over time, the subsidy rate has
remained untouched. In 2015, the new national
administration announced the lowering the
subsidy share of energy tariffs. Nevertheless,
agricultural beneficiaries continued to receive
the subsidy provided by the province, where the
total amount of subsidy budget increased to USD
1.89 million, representing a 55% increase.
Attempts to withdraw the energy subsidies for
agricultural irrigation have not been successful
in the past.
Currency devaluation started in 2002 and
followed with adjustments in the valuation of the
Argentinean peso over a decade. This implied
local adjustments in the energy prices despite
government support as shown in Fig. 5, where
prices for (A) high-demand and (B) low-demand
periods are exposed. Energy consumption for
pumping groundwater increased substantially
from 2009 until 2011 mainly driven by the
mentioned water scarcity period.
0
2
4
6
8
0
100
200
300
400
500
600
2004
2010
2012
2014
2016
US dollar per kilowatt hour ($/kWh)
Thousands kilowatt hour ('000 kWh)
Energy for agricultural irrigation
Average subsidy cost (USD/kWh)
Fig. 4 Energy consumed for
agricultural irrigation in
Mendoza (2004–2017);
source based on collected data
and DEIE (2014), EPRE
(2017, 2018)
Table 3 Energy subsidy scheme for irrigation according to pumping equipment (2012 data)
Pumping equipment power
Lower voltage
Medium voltage
High-demand (%)
Low-demand (%)
High-demand (%)
Low-demand (%)
<10 kW
57.4
79.0
63.2
79.0
10 < kW < 300
57.3
79.0
63.1
79.0
>300 kW
50.5
69.6
55.6
69.6
Source Own based on EPRE (2017)
136
F. S. Riera and B. Brümmer