

construction the river carries less sediment,
therefore the distributed waters filtrate easily on
the ground; this phenomenon is known as “clear
waters”. Until 1999, an accurate estimation of the
groundwater abstraction in the Carrizal aquifer
was 66.7 km
3 per year (Hernández et al. 2012).
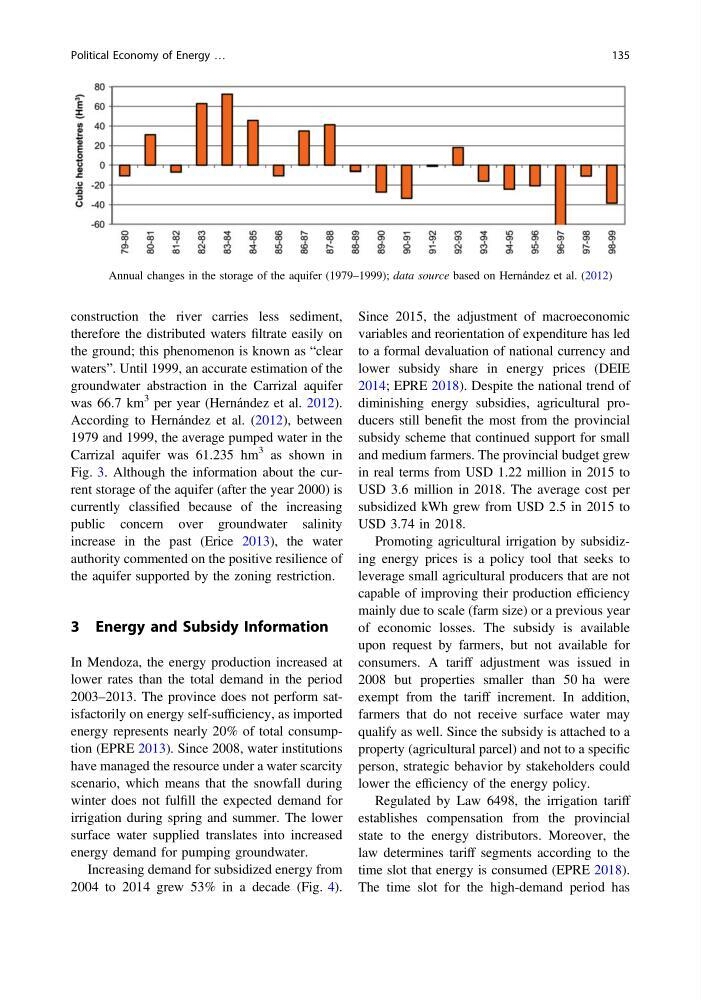
According to Hernández et al. (2012), between
1979 and 1999, the average pumped water in the
Carrizal aquifer was 61.235 hm
3 as shown in
Fig. 3. Although the information about the current storage of the aquifer (after the year 2000) is
currently classified because of the increasing
public concern over groundwater salinity
increase in the past (Erice 2013), the water
authority commented on the positive resilience of
the aquifer supported by the zoning restriction.
3 Energy and Subsidy Information
In Mendoza, the energy production increased at
lower rates than the total demand in the period
2003–2013. The province does not perform satisfactorily on energy self-sufficiency, as imported
energy represents nearly 20% of total consumption (EPRE 2013). Since 2008, water institutions
have managed the resource under a water scarcity
scenario, which means that the snowfall during
winter does not fulfill the expected demand for
irrigation during spring and summer. The lower
surface water supplied translates into increased
energy demand for pumping groundwater.
Increasing demand for subsidized energy from
2004 to 2014 grew 53% in a decade (Fig. 4).
Since 2015, the adjustment of macroeconomic
variables and reorientation of expenditure has led
to a formal devaluation of national currency and
lower subsidy share in energy prices (DEIE
2014; EPRE 2018). Despite the national trend of
diminishing energy subsidies, agricultural producers still benefit the most from the provincial
subsidy scheme that continued support for small
and medium farmers. The provincial budget grew
in real terms from USD 1.22 million in 2015 to
USD 3.6 million in 2018. The average cost per
subsidized kWh grew from USD 2.5 in 2015 to
USD 3.74 in 2018.
Promoting agricultural irrigation by subsidizing energy prices is a policy tool that seeks to
leverage small agricultural producers that are not
capable of improving their production efficiency
mainly due to scale (farm size) or a previous year
of economic losses. The subsidy is available
upon request by farmers, but not available for
consumers. A tariff adjustment was issued in
2008 but properties smaller than 50 ha were
exempt from the tariff increment. In addition,
farmers that do not receive surface water may
qualify as well. Since the subsidy is attached to a
property (agricultural parcel) and not to a specific
person, strategic behavior by stakeholders could
lower the efficiency of the energy policy.
Regulated by Law 6498, the irrigation tariff
establishes compensation from the provincial
state to the energy distributors. Moreover, the
law determines tariff segments according to the
time slot that energy is consumed (EPRE 2018).
The time slot for the high-demand period has
Fig. 3 Annual changes in the storage of the aquifer (1979–1999); data source based on Hernández et al. (2012)
Political Economy of Energy …
135
therefore the distributed waters filtrate easily on
the ground; this phenomenon is known as “clear
waters”. Until 1999, an accurate estimation of the
groundwater abstraction in the Carrizal aquifer
was 66.7 km
3 per year (Hernández et al. 2012).
According to Hernández et al. (2012), between
1979 and 1999, the average pumped water in the
Carrizal aquifer was 61.235 hm
3 as shown in
Fig. 3. Although the information about the current storage of the aquifer (after the year 2000) is
currently classified because of the increasing
public concern over groundwater salinity
increase in the past (Erice 2013), the water
authority commented on the positive resilience of
the aquifer supported by the zoning restriction.
3 Energy and Subsidy Information
In Mendoza, the energy production increased at
lower rates than the total demand in the period
2003–2013. The province does not perform satisfactorily on energy self-sufficiency, as imported
energy represents nearly 20% of total consumption (EPRE 2013). Since 2008, water institutions
have managed the resource under a water scarcity
scenario, which means that the snowfall during
winter does not fulfill the expected demand for
irrigation during spring and summer. The lower
surface water supplied translates into increased
energy demand for pumping groundwater.
Increasing demand for subsidized energy from
2004 to 2014 grew 53% in a decade (Fig. 4).
Since 2015, the adjustment of macroeconomic
variables and reorientation of expenditure has led
to a formal devaluation of national currency and
lower subsidy share in energy prices (DEIE
2014; EPRE 2018). Despite the national trend of
diminishing energy subsidies, agricultural producers still benefit the most from the provincial
subsidy scheme that continued support for small
and medium farmers. The provincial budget grew
in real terms from USD 1.22 million in 2015 to
USD 3.6 million in 2018. The average cost per
subsidized kWh grew from USD 2.5 in 2015 to
USD 3.74 in 2018.
Promoting agricultural irrigation by subsidizing energy prices is a policy tool that seeks to
leverage small agricultural producers that are not
capable of improving their production efficiency
mainly due to scale (farm size) or a previous year
of economic losses. The subsidy is available
upon request by farmers, but not available for
consumers. A tariff adjustment was issued in
2008 but properties smaller than 50 ha were
exempt from the tariff increment. In addition,
farmers that do not receive surface water may
qualify as well. Since the subsidy is attached to a
property (agricultural parcel) and not to a specific
person, strategic behavior by stakeholders could
lower the efficiency of the energy policy.
Regulated by Law 6498, the irrigation tariff
establishes compensation from the provincial
state to the energy distributors. Moreover, the
law determines tariff segments according to the
time slot that energy is consumed (EPRE 2018).
The time slot for the high-demand period has
Fig. 3 Annual changes in the storage of the aquifer (1979–1999); data source based on Hernández et al. (2012)
Political Economy of Energy …
135