

Alderman and Haque 2007; Barnett et al. 2008), and copula
function is in particular powerful to condition the
yield-index to these extremes.
We found that our methodology improves the yield-index
representation, especially in the lower tails of the distribution
and hence increases the risk-reducing properties of
index-based insurances.
5 Conclusions and Recommendations
Carrying out the analysis, we set pricing for all
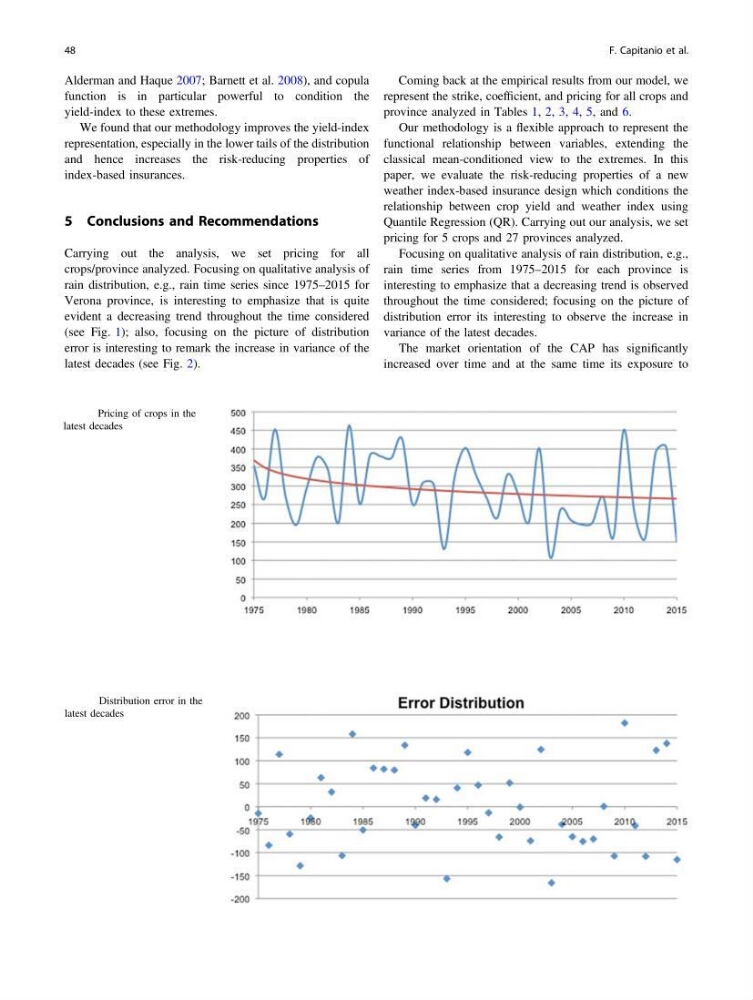
crops/province analyzed. Focusing on qualitative analysis of
rain distribution, e.g., rain time series since 1975–2015 for
Verona province, is interesting to emphasize that is quite
evident a decreasing trend throughout the time considered
(see Fig. 1); also, focusing on the picture of distribution
error is interesting to remark the increase in variance of the
latest decades (see Fig. 2).
Coming back at the empirical results from our model, we
represent the strike, coefficient, and pricing for all crops and
province analyzed in Tables 1, 2, 3, 4, 5, and 6.
Our methodology is a flexible approach to represent the
functional relationship between variables, extending the
classical mean-conditioned view to the extremes. In this
paper, we evaluate the risk-reducing properties of a new
weather index-based insurance design which conditions the
relationship between crop yield and weather index using
Quantile Regression (QR). Carrying out our analysis, we set
pricing for 5 crops and 27 provinces analyzed.
Focusing on qualitative analysis of rain distribution, e.g.,
rain time series from 1975–2015 for each province is
interesting to emphasize that a decreasing trend is observed
throughout the time considered; focusing on the picture of
distribution error its interesting to observe the increase in
variance of the latest decades.
The market orientation of the CAP has significantly
increased over time and at the same time its exposure to
Fig. 1 Pricing of crops in the
latest decades
Fig. 2 Distribution error in the
latest decades
48
F. Capitanio et al.
function is in particular powerful to condition the
yield-index to these extremes.
We found that our methodology improves the yield-index
representation, especially in the lower tails of the distribution
and hence increases the risk-reducing properties of
index-based insurances.
5 Conclusions and Recommendations
Carrying out the analysis, we set pricing for all
crops/province analyzed. Focusing on qualitative analysis of
rain distribution, e.g., rain time series since 1975–2015 for
Verona province, is interesting to emphasize that is quite
evident a decreasing trend throughout the time considered
(see Fig. 1); also, focusing on the picture of distribution
error is interesting to remark the increase in variance of the
latest decades (see Fig. 2).
Coming back at the empirical results from our model, we
represent the strike, coefficient, and pricing for all crops and
province analyzed in Tables 1, 2, 3, 4, 5, and 6.
Our methodology is a flexible approach to represent the
functional relationship between variables, extending the
classical mean-conditioned view to the extremes. In this
paper, we evaluate the risk-reducing properties of a new
weather index-based insurance design which conditions the
relationship between crop yield and weather index using
Quantile Regression (QR). Carrying out our analysis, we set
pricing for 5 crops and 27 provinces analyzed.
Focusing on qualitative analysis of rain distribution, e.g.,
rain time series from 1975–2015 for each province is
interesting to emphasize that a decreasing trend is observed
throughout the time considered; focusing on the picture of
distribution error its interesting to observe the increase in
variance of the latest decades.
The market orientation of the CAP has significantly
increased over time and at the same time its exposure to
Fig. 1 Pricing of crops in the
latest decades
Fig. 2 Distribution error in the
latest decades
48
F. Capitanio et al.