

3.5 Originality
The most studies in the literature focus on just one climatic
variable: rain and, in some cases, temperature. The use of
copula function combined with the quantile regression
technique in the multivariate field, considering both rain and
temperature, is an interesting methodological advancement
aimed to overcome the limitations associated with the linearity and to the excessive rigidity of the models used so far
and which allows, in this way, to obtain estimates that are
more reliable.
4 Findings: Results and Related
Considerations
Phase 2 consists of the following steps:
1. We use available data on FC to calculate the parameters
of their probability distribution.
2. Calculate the expected value (pure risk premium or
actuarial) as a result of specific climate events.
3. The expected value would be increased by a risk factor
and a mark up for administrative and operational costs.
The amount resulting would represent the insurance
premium.
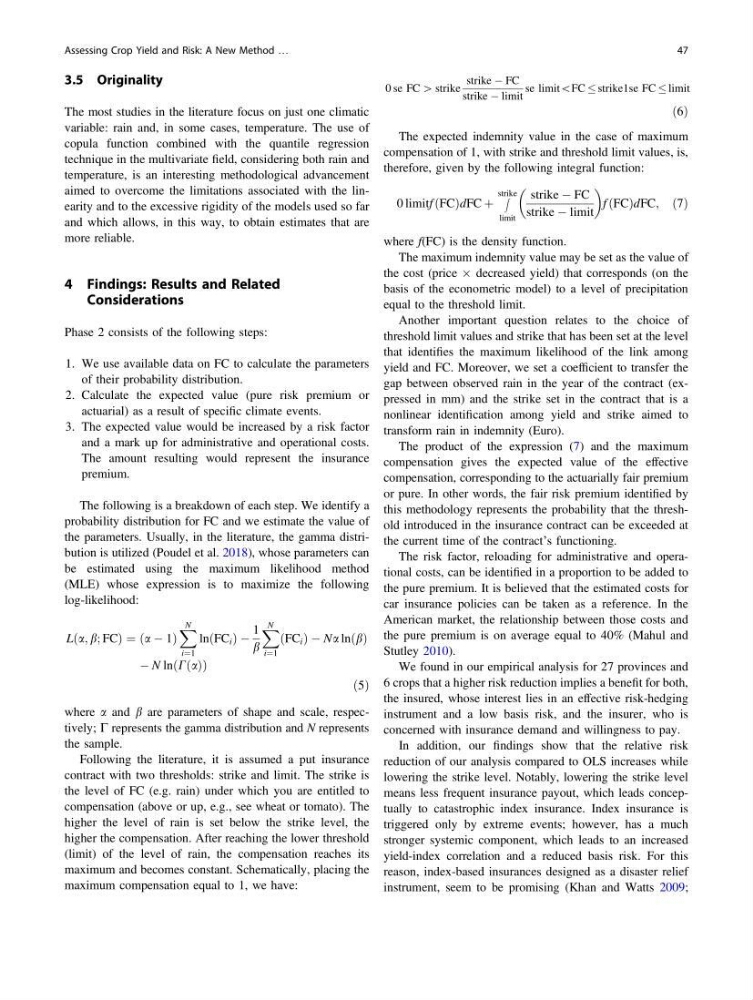
The following is a breakdown of each step. We identify a
probability distribution for FC and we estimate the value of
the parameters. Usually, in the literature, the gamma distribution is utilized (Poudel et al. 2018), whose parameters can
be estimated using the maximum likelihood method
(MLE) whose expression is to maximize the following
log-likelihood:
L a; b; FC
ð
Þ¼ð a À 1Þ
X N
i¼1
ln FC i
ð ÞÀ
1
b
X N
i¼1
FC i
ð ÞÀNa ln b
ð Þ
À N ln C a
ð Þ
ð
Þ
ð5Þ
where a and b are parameters of shape and scale, respectively; C represents the gamma distribution and N represents
the sample.
Following the literature, it is assumed a put insurance
contract with two thresholds: strike and limit. The strike is
the level of FC (e.g. rain) under which you are entitled to
compensation (above or up, e.g., see wheat or tomato). The
higher the level of rain is set below the strike level, the
higher the compensation. After reaching the lower threshold
(limit) of the level of rain, the compensation reaches its
maximum and becomes constant. Schematically, placing the
maximum compensation equal to 1, we have:
0 se FC [ strike
strike À FC
strike À limit
se limit\FC strike1se FC limit
ð6Þ
The expected indemnity value in the case of maximum
compensation of 1, with strike and threshold limit values, is,
therefore, given by the following integral function:
0 limitf FC
ð ÞdFC þ
Z
strike
limit
strike À FC
strike À limit
f FC
ð ÞdFC; ð7Þ
where f(FC) is the density function.
The maximum indemnity value may be set as the value of
the cost (price  decreased yield) that corresponds (on the
basis of the econometric model) to a level of precipitation
equal to the threshold limit.
Another important question relates to the choice of
threshold limit values and strike that has been set at the level
that identifies the maximum likelihood of the link among
yield and FC. Moreover, we set a coefficient to transfer the
gap between observed rain in the year of the contract (expressed in mm) and the strike set in the contract that is a
nonlinear identification among yield and strike aimed to
transform rain in indemnity (Euro).
The product of the expression (7) and the maximum
compensation gives the expected value of the effective
compensation, corresponding to the actuarially fair premium
or pure. In other words, the fair risk premium identified by
this methodology represents the probability that the threshold introduced in the insurance contract can be exceeded at
the current time of the contract’s functioning.
The risk factor, reloading for administrative and operational costs, can be identified in a proportion to be added to
the pure premium. It is believed that the estimated costs for
car insurance policies can be taken as a reference. In the
American market, the relationship between those costs and
the pure premium is on average equal to 40% (Mahul and
Stutley 2010).
We found in our empirical analysis for 27 provinces and
6 crops that a higher risk reduction implies a benefit for both,
the insured, whose interest lies in an effective risk-hedging
instrument and a low basis risk, and the insurer, who is
concerned with insurance demand and willingness to pay.
In addition, our findings show that the relative risk
reduction of our analysis compared to OLS increases while
lowering the strike level. Notably, lowering the strike level
means less frequent insurance payout, which leads conceptually to catastrophic index insurance. Index insurance is
triggered only by extreme events; however, has a much
stronger systemic component, which leads to an increased
yield-index correlation and a reduced basis risk. For this
reason, index-based insurances designed as a disaster relief
instrument, seem to be promising (Khan and Watts 2009;
Assessing Crop Yield and Risk: A New Method …
47
The most studies in the literature focus on just one climatic
variable: rain and, in some cases, temperature. The use of
copula function combined with the quantile regression
technique in the multivariate field, considering both rain and
temperature, is an interesting methodological advancement
aimed to overcome the limitations associated with the linearity and to the excessive rigidity of the models used so far
and which allows, in this way, to obtain estimates that are
more reliable.
4 Findings: Results and Related
Considerations
Phase 2 consists of the following steps:
1. We use available data on FC to calculate the parameters
of their probability distribution.
2. Calculate the expected value (pure risk premium or
actuarial) as a result of specific climate events.
3. The expected value would be increased by a risk factor
and a mark up for administrative and operational costs.
The amount resulting would represent the insurance
premium.
The following is a breakdown of each step. We identify a
probability distribution for FC and we estimate the value of
the parameters. Usually, in the literature, the gamma distribution is utilized (Poudel et al. 2018), whose parameters can
be estimated using the maximum likelihood method
(MLE) whose expression is to maximize the following
log-likelihood:
L a; b; FC
ð
Þ¼ð a À 1Þ
X N
i¼1
ln FC i
ð ÞÀ
1
b
X N
i¼1
FC i
ð ÞÀNa ln b
ð Þ
À N ln C a
ð Þ
ð
Þ
ð5Þ
where a and b are parameters of shape and scale, respectively; C represents the gamma distribution and N represents
the sample.
Following the literature, it is assumed a put insurance
contract with two thresholds: strike and limit. The strike is
the level of FC (e.g. rain) under which you are entitled to
compensation (above or up, e.g., see wheat or tomato). The
higher the level of rain is set below the strike level, the
higher the compensation. After reaching the lower threshold
(limit) of the level of rain, the compensation reaches its
maximum and becomes constant. Schematically, placing the
maximum compensation equal to 1, we have:
0 se FC [ strike
strike À FC
strike À limit
se limit\FC strike1se FC limit
ð6Þ
The expected indemnity value in the case of maximum
compensation of 1, with strike and threshold limit values, is,
therefore, given by the following integral function:
0 limitf FC
ð ÞdFC þ
Z
strike
limit
strike À FC
strike À limit
f FC
ð ÞdFC; ð7Þ
where f(FC) is the density function.
The maximum indemnity value may be set as the value of
the cost (price  decreased yield) that corresponds (on the
basis of the econometric model) to a level of precipitation
equal to the threshold limit.
Another important question relates to the choice of
threshold limit values and strike that has been set at the level
that identifies the maximum likelihood of the link among
yield and FC. Moreover, we set a coefficient to transfer the
gap between observed rain in the year of the contract (expressed in mm) and the strike set in the contract that is a
nonlinear identification among yield and strike aimed to
transform rain in indemnity (Euro).
The product of the expression (7) and the maximum
compensation gives the expected value of the effective
compensation, corresponding to the actuarially fair premium
or pure. In other words, the fair risk premium identified by
this methodology represents the probability that the threshold introduced in the insurance contract can be exceeded at
the current time of the contract’s functioning.
The risk factor, reloading for administrative and operational costs, can be identified in a proportion to be added to
the pure premium. It is believed that the estimated costs for
car insurance policies can be taken as a reference. In the
American market, the relationship between those costs and
the pure premium is on average equal to 40% (Mahul and
Stutley 2010).
We found in our empirical analysis for 27 provinces and
6 crops that a higher risk reduction implies a benefit for both,
the insured, whose interest lies in an effective risk-hedging
instrument and a low basis risk, and the insurer, who is
concerned with insurance demand and willingness to pay.
In addition, our findings show that the relative risk
reduction of our analysis compared to OLS increases while
lowering the strike level. Notably, lowering the strike level
means less frequent insurance payout, which leads conceptually to catastrophic index insurance. Index insurance is
triggered only by extreme events; however, has a much
stronger systemic component, which leads to an increased
yield-index correlation and a reduced basis risk. For this
reason, index-based insurances designed as a disaster relief
instrument, seem to be promising (Khan and Watts 2009;
Assessing Crop Yield and Risk: A New Method …
47