

molar weights of Ca (Mw Ca), the molar weights of CO 2
(Mw CO 2 ) and the total theoretical Ca content of the fresh
solid waste (Ca total), determined from ICP analysis, as
expressed by Eq. 4:
n Ca %
ð Þ ¼
CO 2 wt%
ð
Þ
100ÀCO 2 wt%
ð
Þ
Â
MW Ca kg/mol
ð
Þ
MW CO 2 kg/mol
ð
Þ
Ca total kg/kg
ð
Þ
 100 ð4Þ
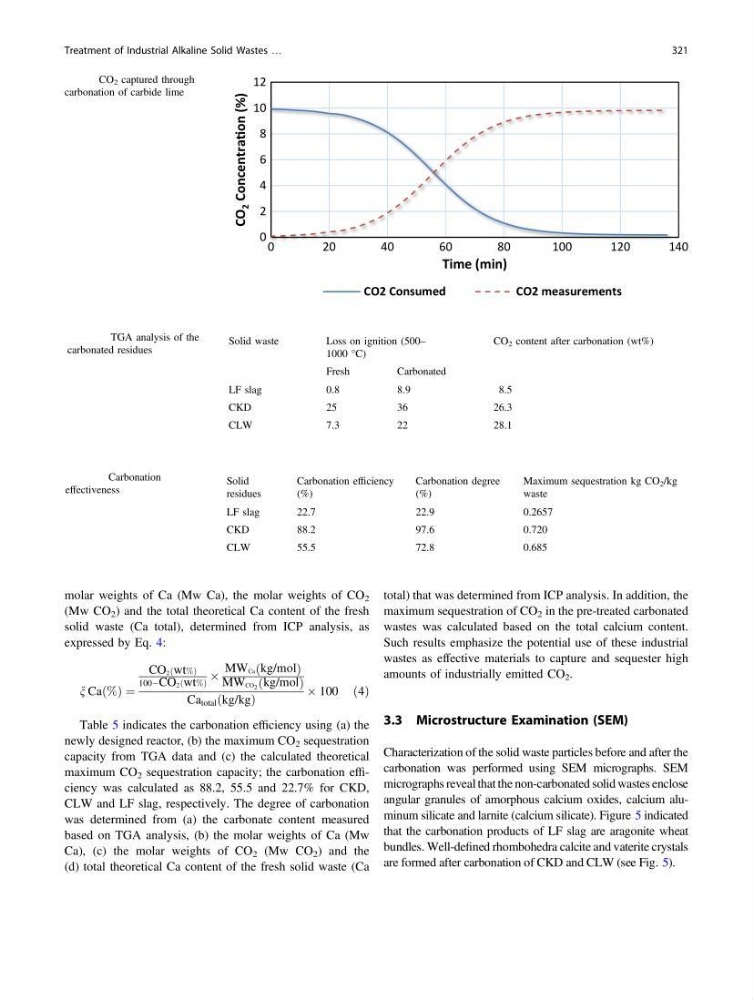
Table 5 indicates the carbonation efficiency using (a) the
newly designed reactor, (b) the maximum CO 2 sequestration
capacity from TGA data and (c) the calculated theoretical
maximum CO 2 sequestration capacity; the carbonation efficiency was calculated as 88.2, 55.5 and 22.7% for CKD,
CLW and LF slag, respectively. The degree of carbonation
was determined from (a) the carbonate content measured
based on TGA analysis, (b) the molar weights of Ca (Mw
Ca), (c) the molar weights of CO 2 (Mw CO 2 ) and the
(d) total theoretical Ca content of the fresh solid waste (Ca
total) that was determined from ICP analysis. In addition, the
maximum sequestration of CO 2 in the pre-treated carbonated
wastes was calculated based on the total calcium content.
Such results emphasize the potential use of these industrial
wastes as effective materials to capture and sequester high
amounts of industrially emitted CO 2 .
3.3 Microstructure Examination (SEM)
Characterization of the solid waste particles before and after the
carbonation was performed using SEM micrographs. SEM
micrographs reveal that the non-carbonated solid wastes enclose
angular granules of amorphous calcium oxides, calcium aluminum silicate and larnite (calcium silicate). Figure 5 indicated
that the carbonation products of LF slag are aragonite wheat
bundles. Well-defined rhombohedra calcite and vaterite crystals
are formed after carbonation of CKD and CLW (see Fig. 5).
0
2
4
6
8
10
12
0
20
40
60
80
100
120
140
CO
2 ConcentraƟon (%)
Time (min)
CO2 Consumed
CO2 measurements
Fig. 4 CO 2 captured through
carbonation of carbide lime
Table 4 TGA analysis of the
carbonated residues
Solid waste
Loss on ignition (500–
1000 °C)
CO 2 content after carbonation (wt%)
Fresh
Carbonated
LF slag
0.8
8.9
8.5
CKD
25
36
26.3
CLW
7.3
22
28.1
Table 5 Carbonation
effectiveness
Solid
residues
Carbonation efficiency
(%)
Carbonation degree
(%)
Maximum sequestration kg CO 2 /kg
waste
LF slag
22.7
22.9
0.2657
CKD
88.2
97.6
0.720
CLW
55.5
72.8
0.685
Treatment of Industrial Alkaline Solid Wastes …
321
(Mw CO 2 ) and the total theoretical Ca content of the fresh
solid waste (Ca total), determined from ICP analysis, as
expressed by Eq. 4:
n Ca %
ð Þ ¼
CO 2 wt%
ð
Þ
100ÀCO 2 wt%
ð
Þ
Â
MW Ca kg/mol
ð
Þ
MW CO 2 kg/mol
ð
Þ
Ca total kg/kg
ð
Þ
 100 ð4Þ
Table 5 indicates the carbonation efficiency using (a) the
newly designed reactor, (b) the maximum CO 2 sequestration
capacity from TGA data and (c) the calculated theoretical
maximum CO 2 sequestration capacity; the carbonation efficiency was calculated as 88.2, 55.5 and 22.7% for CKD,
CLW and LF slag, respectively. The degree of carbonation
was determined from (a) the carbonate content measured
based on TGA analysis, (b) the molar weights of Ca (Mw
Ca), (c) the molar weights of CO 2 (Mw CO 2 ) and the
(d) total theoretical Ca content of the fresh solid waste (Ca
total) that was determined from ICP analysis. In addition, the
maximum sequestration of CO 2 in the pre-treated carbonated
wastes was calculated based on the total calcium content.
Such results emphasize the potential use of these industrial
wastes as effective materials to capture and sequester high
amounts of industrially emitted CO 2 .
3.3 Microstructure Examination (SEM)
Characterization of the solid waste particles before and after the
carbonation was performed using SEM micrographs. SEM
micrographs reveal that the non-carbonated solid wastes enclose
angular granules of amorphous calcium oxides, calcium aluminum silicate and larnite (calcium silicate). Figure 5 indicated
that the carbonation products of LF slag are aragonite wheat
bundles. Well-defined rhombohedra calcite and vaterite crystals
are formed after carbonation of CKD and CLW (see Fig. 5).
0
2
4
6
8
10
12
0
20
40
60
80
100
120
140
CO
2 ConcentraƟon (%)
Time (min)
CO2 Consumed
CO2 measurements
Fig. 4 CO 2 captured through
carbonation of carbide lime
Table 4 TGA analysis of the
carbonated residues
Solid waste
Loss on ignition (500–
1000 °C)
CO 2 content after carbonation (wt%)
Fresh
Carbonated
LF slag
0.8
8.9
8.5
CKD
25
36
26.3
CLW
7.3
22
28.1
Table 5 Carbonation
effectiveness
Solid
residues
Carbonation efficiency
(%)
Carbonation degree
(%)
Maximum sequestration kg CO 2 /kg
waste
LF slag
22.7
22.9
0.2657
CKD
88.2
97.6
0.720
CLW
55.5
72.8
0.685
Treatment of Industrial Alkaline Solid Wastes …
321