

shown on the gas analyzer from the fixed entrance concentration supplied by gas mixture cylinder, 10% CO 2 balanced
with air.
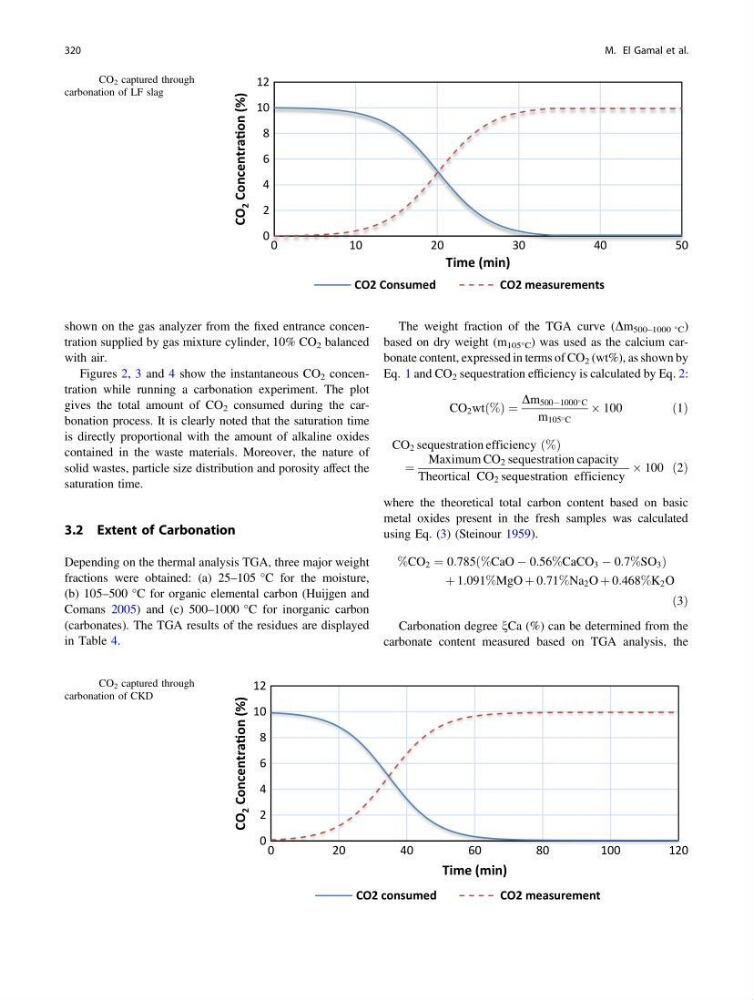
Figures 2, 3 and 4 show the instantaneous CO 2 concentration while running a carbonation experiment. The plot
gives the total amount of CO 2 consumed during the carbonation process. It is clearly noted that the saturation time
is directly proportional with the amount of alkaline oxides
contained in the waste materials. Moreover, the nature of
solid wastes, particle size distribution and porosity affect the
saturation time.
3.2 Extent of Carbonation
Depending on the thermal analysis TGA, three major weight
fractions were obtained: (a) 25–105 °C for the moisture,
(b) 105–500 °C for organic elemental carbon (Huijgen and
Comans 2005) and (c) 500–1000 °C for inorganic carbon
(carbonates). The TGA results of the residues are displayed
in Table 4.
The weight fraction of the TGA curve (Dm 500–1000 °C )
based on dry weight (m 105°C ) was used as the calcium carbonate content, expressed in terms of CO 2 (wt%), as shown by
Eq. 1 and CO 2 sequestration efficiency is calculated by Eq. 2:
CO 2 wt %
ð Þ ¼
Dm 500À1000 C
m 105 C
 100
ð1Þ
CO 2 sequestration efficiency %
ð Þ
¼
Maximum CO 2 sequestration capacity
Theortical CO 2 sequestration efficiency
 100 ð2Þ
where the theoretical total carbon content based on basic
metal oxides present in the fresh samples was calculated
using Eq. (3) (Steinour 1959).
%CO 2 ¼ 0:785 %CaO À 0:56%CaCO 3 À 0:7%SO 3
ð
Þ
þ 1:091%MgO þ 0:71%Na 2 O þ 0:468%K 2 O
ð3Þ
Carbonation degree nCa (%) can be determined from the
carbonate content measured based on TGA analysis, the
0
2
4
6
8
10
12
0
1 0
2 0
3 0
4 0
5 0
CO
2 ConcentraƟon (%)
Time (min)
CO2 Consumed
CO2 measurements
Fig. 2 CO 2 captured through
carbonation of LF slag
0
2
4
6
8
10
12
0
20
40
60
80
100
120
CO
2 ConcentraƟon (%)
Time (min)
CO2 consumed
CO2 measurement
Fig. 3 CO 2 captured through
carbonation of CKD
320
M. El Gamal et al.
with air.
Figures 2, 3 and 4 show the instantaneous CO 2 concentration while running a carbonation experiment. The plot
gives the total amount of CO 2 consumed during the carbonation process. It is clearly noted that the saturation time
is directly proportional with the amount of alkaline oxides
contained in the waste materials. Moreover, the nature of
solid wastes, particle size distribution and porosity affect the
saturation time.
3.2 Extent of Carbonation
Depending on the thermal analysis TGA, three major weight
fractions were obtained: (a) 25–105 °C for the moisture,
(b) 105–500 °C for organic elemental carbon (Huijgen and
Comans 2005) and (c) 500–1000 °C for inorganic carbon
(carbonates). The TGA results of the residues are displayed
in Table 4.
The weight fraction of the TGA curve (Dm 500–1000 °C )
based on dry weight (m 105°C ) was used as the calcium carbonate content, expressed in terms of CO 2 (wt%), as shown by
Eq. 1 and CO 2 sequestration efficiency is calculated by Eq. 2:
CO 2 wt %
ð Þ ¼
Dm 500À1000 C
m 105 C
 100
ð1Þ
CO 2 sequestration efficiency %
ð Þ
¼
Maximum CO 2 sequestration capacity
Theortical CO 2 sequestration efficiency
 100 ð2Þ
where the theoretical total carbon content based on basic
metal oxides present in the fresh samples was calculated
using Eq. (3) (Steinour 1959).
%CO 2 ¼ 0:785 %CaO À 0:56%CaCO 3 À 0:7%SO 3
ð
Þ
þ 1:091%MgO þ 0:71%Na 2 O þ 0:468%K 2 O
ð3Þ
Carbonation degree nCa (%) can be determined from the
carbonate content measured based on TGA analysis, the
0
2
4
6
8
10
12
0
1 0
2 0
3 0
4 0
5 0
CO
2 ConcentraƟon (%)
Time (min)
CO2 Consumed
CO2 measurements
Fig. 2 CO 2 captured through
carbonation of LF slag
0
2
4
6
8
10
12
0
20
40
60
80
100
120
CO
2 ConcentraƟon (%)
Time (min)
CO2 consumed
CO2 measurement
Fig. 3 CO 2 captured through
carbonation of CKD
320
M. El Gamal et al.