

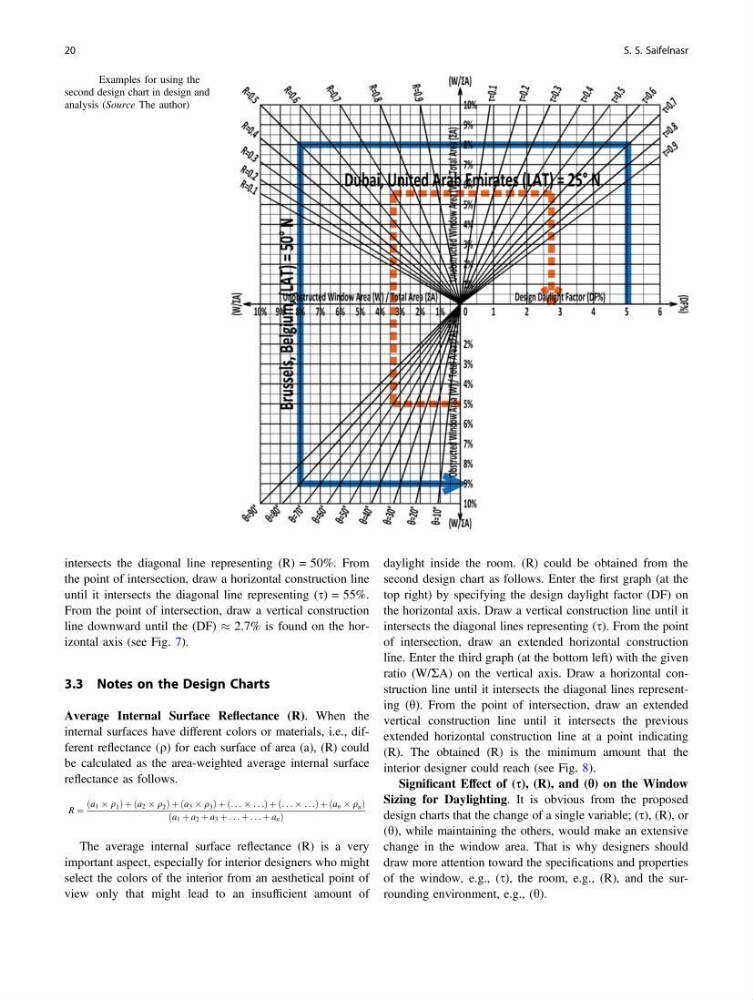
intersects the diagonal line representing (R) = 50%. From
the point of intersection, draw a horizontal construction line
until it intersects the diagonal line representing (s) = 55%.
From the point of intersection, draw a vertical construction
line downward until the (DF) % 2.7% is found on the horizontal axis (see Fig. 7).
3.3 Notes on the Design Charts
Average Internal Surface Reflectance (R). When the
internal surfaces have different colors or materials, i.e., different reflectance (q) for each surface of area (a), (R) could
be calculated as the area-weighted average internal surface
reflectance as follows.
R ¼
a 1 Â q 1
ð
Þþ a 2 Â q 2
ð
Þþ a 3 Â q 3
ð
Þþ . . . Â . . .
ð
Þ þ. . . Â . . .
ð
Þ þa n  q n
ð
Þ
a 1 þ a 2 þ a 3 þ . . . þ . . . þ a n
ð
Þ
The average internal surface reflectance (R) is a very
important aspect, especially for interior designers who might
select the colors of the interior from an aesthetical point of
view only that might lead to an insufficient amount of
daylight inside the room. (R) could be obtained from the
second design chart as follows. Enter the first graph (at the
top right) by specifying the design daylight factor (DF) on
the horizontal axis. Draw a vertical construction line until it
intersects the diagonal lines representing (s). From the point
of intersection, draw an extended horizontal construction
line. Enter the third graph (at the bottom left) with the given
ratio (W/RA) on the vertical axis. Draw a horizontal construction line until it intersects the diagonal lines representing (h). From the point of intersection, draw an extended
vertical construction line until it intersects the previous
extended horizontal construction line at a point indicating
(R). The obtained (R) is the minimum amount that the
interior designer could reach (see Fig. 8).
Significant Effect of (s), (R), and (h) on the Window
Sizing for Daylighting. It is obvious from the proposed
design charts that the change of a single variable; (s), (R), or
(h), while maintaining the others, would make an extensive
change in the window area. That is why designers should
draw more attention toward the specifications and properties
of the window, e.g., (s), the room, e.g., (R), and the surrounding environment, e.g., (h).
Fig. 7 Examples for using the
second design chart in design and
analysis (Source The author)
20
S. S. Saifelnasr
the point of intersection, draw a horizontal construction line
until it intersects the diagonal line representing (s) = 55%.
From the point of intersection, draw a vertical construction
line downward until the (DF) % 2.7% is found on the horizontal axis (see Fig. 7).
3.3 Notes on the Design Charts
Average Internal Surface Reflectance (R). When the
internal surfaces have different colors or materials, i.e., different reflectance (q) for each surface of area (a), (R) could
be calculated as the area-weighted average internal surface
reflectance as follows.
R ¼
a 1 Â q 1
ð
Þþ a 2 Â q 2
ð
Þþ a 3 Â q 3
ð
Þþ . . . Â . . .
ð
Þ þ. . . Â . . .
ð
Þ þa n  q n
ð
Þ
a 1 þ a 2 þ a 3 þ . . . þ . . . þ a n
ð
Þ
The average internal surface reflectance (R) is a very
important aspect, especially for interior designers who might
select the colors of the interior from an aesthetical point of
view only that might lead to an insufficient amount of
daylight inside the room. (R) could be obtained from the
second design chart as follows. Enter the first graph (at the
top right) by specifying the design daylight factor (DF) on
the horizontal axis. Draw a vertical construction line until it
intersects the diagonal lines representing (s). From the point
of intersection, draw an extended horizontal construction
line. Enter the third graph (at the bottom left) with the given
ratio (W/RA) on the vertical axis. Draw a horizontal construction line until it intersects the diagonal lines representing (h). From the point of intersection, draw an extended
vertical construction line until it intersects the previous
extended horizontal construction line at a point indicating
(R). The obtained (R) is the minimum amount that the
interior designer could reach (see Fig. 8).
Significant Effect of (s), (R), and (h) on the Window
Sizing for Daylighting. It is obvious from the proposed
design charts that the change of a single variable; (s), (R), or
(h), while maintaining the others, would make an extensive
change in the window area. That is why designers should
draw more attention toward the specifications and properties
of the window, e.g., (s), the room, e.g., (R), and the surrounding environment, e.g., (h).
Fig. 7 Examples for using the
second design chart in design and
analysis (Source The author)
20
S. S. Saifelnasr