

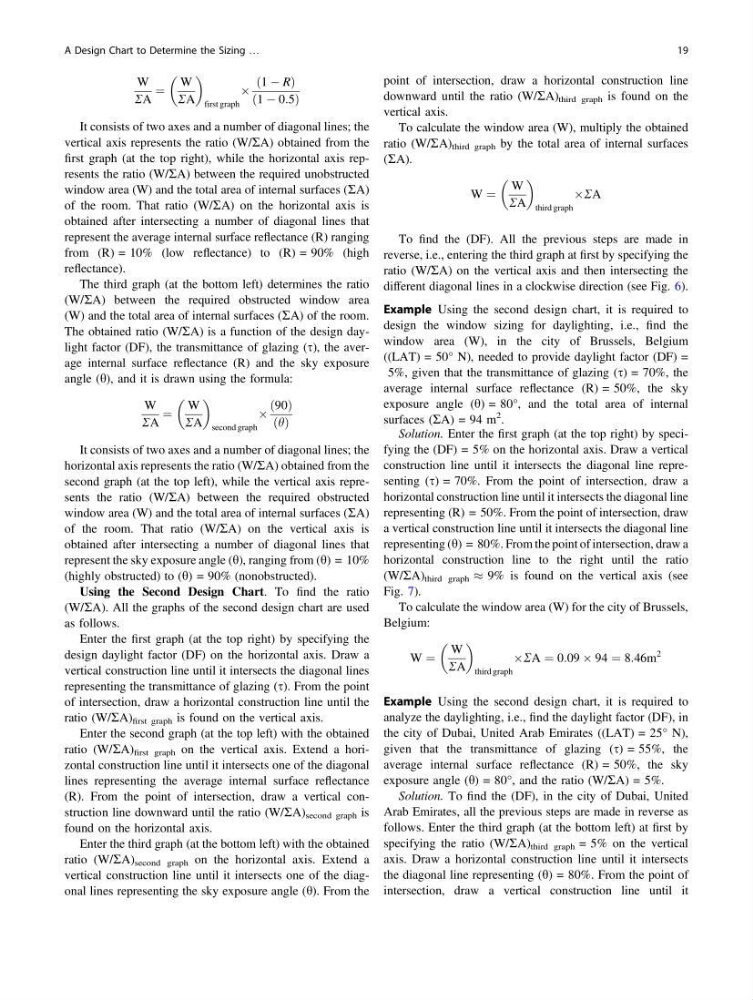
W
RA
¼
W
RA
first graph
Â
1 À R
ð
Þ
1 À 0:5
ð
Þ
It consists of two axes and a number of diagonal lines; the
vertical axis represents the ratio (W/RA) obtained from the
first graph (at the top right), while the horizontal axis represents the ratio (W/RA) between the required unobstructed
window area (W) and the total area of internal surfaces (RA)
of the room. That ratio (W/RA) on the horizontal axis is
obtained after intersecting a number of diagonal lines that
represent the average internal surface reflectance (R) ranging
from (R) = 10% (low reflectance) to (R) = 90% (high
reflectance).
The third graph (at the bottom left) determines the ratio
(W/RA) between the required obstructed window area
(W) and the total area of internal surfaces (RA) of the room.
The obtained ratio (W/RA) is a function of the design daylight factor (DF), the transmittance of glazing (s), the average internal surface reflectance (R) and the sky exposure
angle (h), and it is drawn using the formula:
W
RA
¼
W
RA
second graph
Â
90
ð Þ
h
ð Þ
It consists of two axes and a number of diagonal lines; the
horizontal axis represents the ratio (W/RA) obtained from the
second graph (at the top left), while the vertical axis represents the ratio (W/RA) between the required obstructed
window area (W) and the total area of internal surfaces (RA)
of the room. That ratio (W/RA) on the vertical axis is
obtained after intersecting a number of diagonal lines that
represent the sky exposure angle (h), ranging from (h) = 10%
(highly obstructed) to (h) = 90% (nonobstructed).
Using the Second Design Chart. To find the ratio
(W/RA). All the graphs of the second design chart are used
as follows.
Enter the first graph (at the top right) by specifying the
design daylight factor (DF) on the horizontal axis. Draw a
vertical construction line until it intersects the diagonal lines
representing the transmittance of glazing (s). From the point
of intersection, draw a horizontal construction line until the
ratio (W/RA) first graph is found on the vertical axis.
Enter the second graph (at the top left) with the obtained
ratio (W/RA) first graph on the vertical axis. Extend a horizontal construction line until it intersects one of the diagonal
lines representing the average internal surface reflectance
(R). From the point of intersection, draw a vertical construction line downward until the ratio (W/RA) second graph is
found on the horizontal axis.
Enter the third graph (at the bottom left) with the obtained
ratio (W/RA) second graph on the horizontal axis. Extend a
vertical construction line until it intersects one of the diagonal lines representing the sky exposure angle (h). From the
point of intersection, draw a horizontal construction line
downward until the ratio (W/RA) third graph is found on the
vertical axis.
To calculate the window area (W), multiply the obtained
ratio (W/RA) third graph by the total area of internal surfaces
(RA).
W ¼
W
RA
third graph
ÂRA
To find the (DF). All the previous steps are made in
reverse, i.e., entering the third graph at first by specifying the
ratio (W/RA) on the vertical axis and then intersecting the
different diagonal lines in a clockwise direction (see Fig. 6).
Example Using the second design chart, it is required to
design the window sizing for daylighting, i.e., find the
window area (W), in the city of Brussels, Belgium
((LAT) = 50° N), needed to provide daylight factor (DF) =
5%, given that the transmittance of glazing (s) = 70%, the
average internal surface reflectance (R) = 50%, the sky
exposure angle (h) = 80°, and the total area of internal
surfaces (RA) = 94 m
2 .
Solution. Enter the first graph (at the top right) by specifying the (DF) = 5% on the horizontal axis. Draw a vertical
construction line until it intersects the diagonal line representing (s) = 70%. From the point of intersection, draw a
horizontal construction line until it intersects the diagonal line
representing (R) = 50%. From the point of intersection, draw
a vertical construction line until it intersects the diagonal line
representing (h) = 80%. From the point of intersection, draw a
horizontal construction line to the right until the ratio
(W/RA) third graph % 9% is found on the vertical axis (see
Fig. 7).
To calculate the window area (W) for the city of Brussels,
Belgium:
W ¼
W
RA
third graph
ÂRA ¼ 0:09 Â 94 ¼ 8:46m
2
Example Using the second design chart, it is required to
analyze the daylighting, i.e., find the daylight factor (DF), in
the city of Dubai, United Arab Emirates ((LAT) = 25° N),
given that the transmittance of glazing (s) = 55%, the
average internal surface reflectance (R) = 50%, the sky
exposure angle (h) = 80°, and the ratio (W/RA) = 5%.
Solution. To find the (DF), in the city of Dubai, United
Arab Emirates, all the previous steps are made in reverse as
follows. Enter the third graph (at the bottom left) at first by
specifying the ratio (W/RA) third graph = 5% on the vertical
axis. Draw a horizontal construction line until it intersects
the diagonal line representing (h) = 80%. From the point of
intersection, draw a vertical construction line until it
A Design Chart to Determine the Sizing …
19
RA
¼
W
RA
first graph
Â
1 À R
ð
Þ
1 À 0:5
ð
Þ
It consists of two axes and a number of diagonal lines; the
vertical axis represents the ratio (W/RA) obtained from the
first graph (at the top right), while the horizontal axis represents the ratio (W/RA) between the required unobstructed
window area (W) and the total area of internal surfaces (RA)
of the room. That ratio (W/RA) on the horizontal axis is
obtained after intersecting a number of diagonal lines that
represent the average internal surface reflectance (R) ranging
from (R) = 10% (low reflectance) to (R) = 90% (high
reflectance).
The third graph (at the bottom left) determines the ratio
(W/RA) between the required obstructed window area
(W) and the total area of internal surfaces (RA) of the room.
The obtained ratio (W/RA) is a function of the design daylight factor (DF), the transmittance of glazing (s), the average internal surface reflectance (R) and the sky exposure
angle (h), and it is drawn using the formula:
W
RA
¼
W
RA
second graph
Â
90
ð Þ
h
ð Þ
It consists of two axes and a number of diagonal lines; the
horizontal axis represents the ratio (W/RA) obtained from the
second graph (at the top left), while the vertical axis represents the ratio (W/RA) between the required obstructed
window area (W) and the total area of internal surfaces (RA)
of the room. That ratio (W/RA) on the vertical axis is
obtained after intersecting a number of diagonal lines that
represent the sky exposure angle (h), ranging from (h) = 10%
(highly obstructed) to (h) = 90% (nonobstructed).
Using the Second Design Chart. To find the ratio
(W/RA). All the graphs of the second design chart are used
as follows.
Enter the first graph (at the top right) by specifying the
design daylight factor (DF) on the horizontal axis. Draw a
vertical construction line until it intersects the diagonal lines
representing the transmittance of glazing (s). From the point
of intersection, draw a horizontal construction line until the
ratio (W/RA) first graph is found on the vertical axis.
Enter the second graph (at the top left) with the obtained
ratio (W/RA) first graph on the vertical axis. Extend a horizontal construction line until it intersects one of the diagonal
lines representing the average internal surface reflectance
(R). From the point of intersection, draw a vertical construction line downward until the ratio (W/RA) second graph is
found on the horizontal axis.
Enter the third graph (at the bottom left) with the obtained
ratio (W/RA) second graph on the horizontal axis. Extend a
vertical construction line until it intersects one of the diagonal lines representing the sky exposure angle (h). From the
point of intersection, draw a horizontal construction line
downward until the ratio (W/RA) third graph is found on the
vertical axis.
To calculate the window area (W), multiply the obtained
ratio (W/RA) third graph by the total area of internal surfaces
(RA).
W ¼
W
RA
third graph
ÂRA
To find the (DF). All the previous steps are made in
reverse, i.e., entering the third graph at first by specifying the
ratio (W/RA) on the vertical axis and then intersecting the
different diagonal lines in a clockwise direction (see Fig. 6).
Example Using the second design chart, it is required to
design the window sizing for daylighting, i.e., find the
window area (W), in the city of Brussels, Belgium
((LAT) = 50° N), needed to provide daylight factor (DF) =
5%, given that the transmittance of glazing (s) = 70%, the
average internal surface reflectance (R) = 50%, the sky
exposure angle (h) = 80°, and the total area of internal
surfaces (RA) = 94 m
2 .
Solution. Enter the first graph (at the top right) by specifying the (DF) = 5% on the horizontal axis. Draw a vertical
construction line until it intersects the diagonal line representing (s) = 70%. From the point of intersection, draw a
horizontal construction line until it intersects the diagonal line
representing (R) = 50%. From the point of intersection, draw
a vertical construction line until it intersects the diagonal line
representing (h) = 80%. From the point of intersection, draw a
horizontal construction line to the right until the ratio
(W/RA) third graph % 9% is found on the vertical axis (see
Fig. 7).
To calculate the window area (W) for the city of Brussels,
Belgium:
W ¼
W
RA
third graph
ÂRA ¼ 0:09 Â 94 ¼ 8:46m
2
Example Using the second design chart, it is required to
analyze the daylighting, i.e., find the daylight factor (DF), in
the city of Dubai, United Arab Emirates ((LAT) = 25° N),
given that the transmittance of glazing (s) = 55%, the
average internal surface reflectance (R) = 50%, the sky
exposure angle (h) = 80°, and the ratio (W/RA) = 5%.
Solution. To find the (DF), in the city of Dubai, United
Arab Emirates, all the previous steps are made in reverse as
follows. Enter the third graph (at the bottom left) at first by
specifying the ratio (W/RA) third graph = 5% on the vertical
axis. Draw a horizontal construction line until it intersects
the diagonal line representing (h) = 80%. From the point of
intersection, draw a vertical construction line until it
A Design Chart to Determine the Sizing …
19