

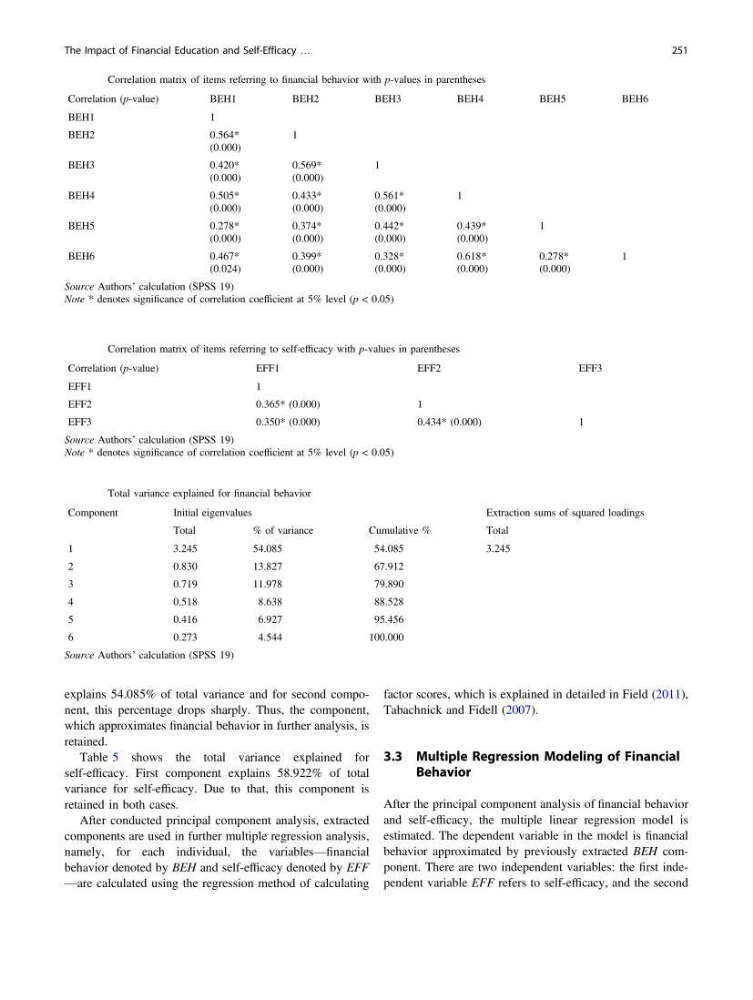
explains 54.085% of total variance and for second component, this percentage drops sharply. Thus, the component,
which approximates financial behavior in further analysis, is
retained.
Table 5 shows the total variance explained for
self-efficacy. First component explains 58.922% of total
variance for self-efficacy. Due to that, this component is
retained in both cases.
After conducted principal component analysis, extracted
components are used in further multiple regression analysis,
namely, for each individual, the variables—financial
behavior denoted by BEH and self-efficacy denoted by EFF
—are calculated using the regression method of calculating
factor scores, which is explained in detailed in Field (2011),
Tabachnick and Fidell (2007).
3.3 Multiple Regression Modeling of Financial
Behavior
After the principal component analysis of financial behavior
and self-efficacy, the multiple linear regression model is
estimated. The dependent variable in the model is financial
behavior approximated by previously extracted BEH component. There are two independent variables: the first independent variable EFF refers to self-efficacy, and the second
Table 2 Correlation matrix of items referring to financial behavior with p-values in parentheses
Correlation (p-value)
BEH1
BEH2
BEH3
BEH4
BEH5
BEH6
BEH1
1
BEH2
0.564*
(0.000)
1
BEH3
0.420*
(0.000)
0.569*
(0.000)
1
BEH4
0.505*
(0.000)
0.433*
(0.000)
0.561*
(0.000)
1
BEH5
0.278*
(0.000)
0.374*
(0.000)
0.442*
(0.000)
0.439*
(0.000)
1
BEH6
0.467*
(0.024)
0.399*
(0.000)
0.328*
(0.000)
0.618*
(0.000)
0.278*
(0.000)
1
Source Authors’ calculation (SPSS 19)
Note * denotes significance of correlation coefficient at 5% level (p < 0.05)
Table 3 Correlation matrix of items referring to self-efficacy with p-values in parentheses
Correlation (p-value)
EFF1
EFF2
EFF3
EFF1
1
EFF2
0.365* (0.000)
1
EFF3
0.350* (0.000)
0.434* (0.000)
1
Source Authors’ calculation (SPSS 19)
Note * denotes significance of correlation coefficient at 5% level (p < 0.05)
Table 4 Total variance explained for financial behavior
Component
Initial eigenvalues
Extraction sums of squared loadings
Total
% of variance
Cumulative %
Total
1
3.245
54.085
54.085
3.245
2
0.830
13.827
67.912
3
0.719
11.978
79.890
4
0.518
8.638
88.528
5
0.416
6.927
95.456
6
0.273
4.544
100.000
Source Authors’ calculation (SPSS 19)
The Impact of Financial Education and Self-Efficacy …
251
which approximates financial behavior in further analysis, is
retained.
Table 5 shows the total variance explained for
self-efficacy. First component explains 58.922% of total
variance for self-efficacy. Due to that, this component is
retained in both cases.
After conducted principal component analysis, extracted
components are used in further multiple regression analysis,
namely, for each individual, the variables—financial
behavior denoted by BEH and self-efficacy denoted by EFF
—are calculated using the regression method of calculating
factor scores, which is explained in detailed in Field (2011),
Tabachnick and Fidell (2007).
3.3 Multiple Regression Modeling of Financial
Behavior
After the principal component analysis of financial behavior
and self-efficacy, the multiple linear regression model is
estimated. The dependent variable in the model is financial
behavior approximated by previously extracted BEH component. There are two independent variables: the first independent variable EFF refers to self-efficacy, and the second
Table 2 Correlation matrix of items referring to financial behavior with p-values in parentheses
Correlation (p-value)
BEH1
BEH2
BEH3
BEH4
BEH5
BEH6
BEH1
1
BEH2
0.564*
(0.000)
1
BEH3
0.420*
(0.000)
0.569*
(0.000)
1
BEH4
0.505*
(0.000)
0.433*
(0.000)
0.561*
(0.000)
1
BEH5
0.278*
(0.000)
0.374*
(0.000)
0.442*
(0.000)
0.439*
(0.000)
1
BEH6
0.467*
(0.024)
0.399*
(0.000)
0.328*
(0.000)
0.618*
(0.000)
0.278*
(0.000)
1
Source Authors’ calculation (SPSS 19)
Note * denotes significance of correlation coefficient at 5% level (p < 0.05)
Table 3 Correlation matrix of items referring to self-efficacy with p-values in parentheses
Correlation (p-value)
EFF1
EFF2
EFF3
EFF1
1
EFF2
0.365* (0.000)
1
EFF3
0.350* (0.000)
0.434* (0.000)
1
Source Authors’ calculation (SPSS 19)
Note * denotes significance of correlation coefficient at 5% level (p < 0.05)
Table 4 Total variance explained for financial behavior
Component
Initial eigenvalues
Extraction sums of squared loadings
Total
% of variance
Cumulative %
Total
1
3.245
54.085
54.085
3.245
2
0.830
13.827
67.912
3
0.719
11.978
79.890
4
0.518
8.638
88.528
5
0.416
6.927
95.456
6
0.273
4.544
100.000
Source Authors’ calculation (SPSS 19)
The Impact of Financial Education and Self-Efficacy …
251