

models of −7.19%. Despite this difference, both models
portray a strong and significant movement in the abnormal
returns of the GBP on the event day of interest. There are
concerns with the robustness of the market model results,
which need to be addressed.
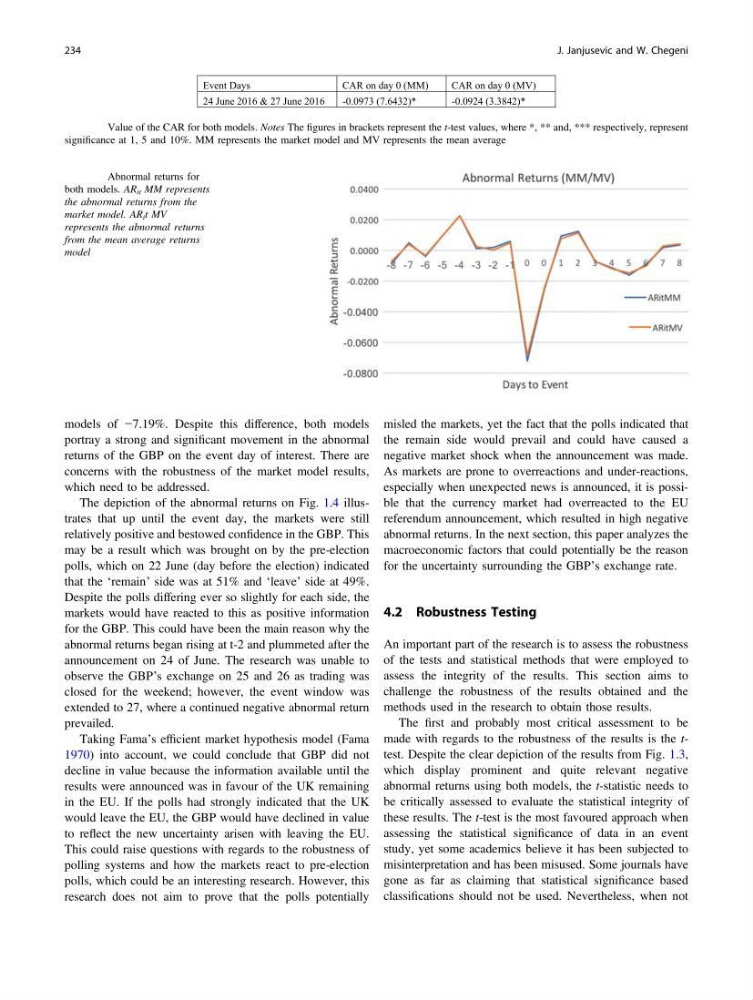
The depiction of the abnormal returns on Fig. 1.4 illustrates that up until the event day, the markets were still
relatively positive and bestowed confidence in the GBP. This
may be a result which was brought on by the pre-election
polls, which on 22 June (day before the election) indicated
that the ‘remain’ side was at 51% and ‘leave’ side at 49%.
Despite the polls differing ever so slightly for each side, the
markets would have reacted to this as positive information
for the GBP. This could have been the main reason why the
abnormal returns began rising at t-2 and plummeted after the
announcement on 24 of June. The research was unable to
observe the GBP’s exchange on 25 and 26 as trading was
closed for the weekend; however, the event window was
extended to 27, where a continued negative abnormal return
prevailed.
Taking Fama’s efficient market hypothesis model (Fama
1970) into account, we could conclude that GBP did not
decline in value because the information available until the
results were announced was in favour of the UK remaining
in the EU. If the polls had strongly indicated that the UK
would leave the EU, the GBP would have declined in value
to reflect the new uncertainty arisen with leaving the EU.
This could raise questions with regards to the robustness of
polling systems and how the markets react to pre-election
polls, which could be an interesting research. However, this
research does not aim to prove that the polls potentially
misled the markets, yet the fact that the polls indicated that
the remain side would prevail and could have caused a
negative market shock when the announcement was made.
As markets are prone to overreactions and under-reactions,
especially when unexpected news is announced, it is possible that the currency market had overreacted to the EU
referendum announcement, which resulted in high negative
abnormal returns. In the next section, this paper analyzes the
macroeconomic factors that could potentially be the reason
for the uncertainty surrounding the GBP’s exchange rate.
4.2 Robustness Testing
An important part of the research is to assess the robustness
of the tests and statistical methods that were employed to
assess the integrity of the results. This section aims to
challenge the robustness of the results obtained and the
methods used in the research to obtain those results.
The first and probably most critical assessment to be
made with regards to the robustness of the results is the ttest. Despite the clear depiction of the results from Fig. 1.3,
which display prominent and quite relevant negative
abnormal returns using both models, the t-statistic needs to
be critically assessed to evaluate the statistical integrity of
these results. The t-test is the most favoured approach when
assessing the statistical significance of data in an event
study, yet some academics believe it has been subjected to
misinterpretation and has been misused. Some journals have
gone as far as claiming that statistical significance based
classifications should not be used. Nevertheless, when not
Event Days
CAR on day 0 (MM)
CAR on day 0 (MV)
24 June 2016 & 27 June 2016
-0.0973 (7.6432)*
-0.0924 (3.3842)*
Fig. 1.3 Value of the CAR for both models. Notes The figures in brackets represent the t-test values, where *, ** and, *** respectively, represent
significance at 1, 5 and 10%. MM represents the market model and MV represents the mean average
Fig. 1.4 Abnormal returns for
both models. AR it MM represents
the abnormal returns from the
market model. AR i t MV
represents the abnormal returns
from the mean average returns
model
234
J. Janjusevic and W. Chegeni
portray a strong and significant movement in the abnormal
returns of the GBP on the event day of interest. There are
concerns with the robustness of the market model results,
which need to be addressed.
The depiction of the abnormal returns on Fig. 1.4 illustrates that up until the event day, the markets were still
relatively positive and bestowed confidence in the GBP. This
may be a result which was brought on by the pre-election
polls, which on 22 June (day before the election) indicated
that the ‘remain’ side was at 51% and ‘leave’ side at 49%.
Despite the polls differing ever so slightly for each side, the
markets would have reacted to this as positive information
for the GBP. This could have been the main reason why the
abnormal returns began rising at t-2 and plummeted after the
announcement on 24 of June. The research was unable to
observe the GBP’s exchange on 25 and 26 as trading was
closed for the weekend; however, the event window was
extended to 27, where a continued negative abnormal return
prevailed.
Taking Fama’s efficient market hypothesis model (Fama
1970) into account, we could conclude that GBP did not
decline in value because the information available until the
results were announced was in favour of the UK remaining
in the EU. If the polls had strongly indicated that the UK
would leave the EU, the GBP would have declined in value
to reflect the new uncertainty arisen with leaving the EU.
This could raise questions with regards to the robustness of
polling systems and how the markets react to pre-election
polls, which could be an interesting research. However, this
research does not aim to prove that the polls potentially
misled the markets, yet the fact that the polls indicated that
the remain side would prevail and could have caused a
negative market shock when the announcement was made.
As markets are prone to overreactions and under-reactions,
especially when unexpected news is announced, it is possible that the currency market had overreacted to the EU
referendum announcement, which resulted in high negative
abnormal returns. In the next section, this paper analyzes the
macroeconomic factors that could potentially be the reason
for the uncertainty surrounding the GBP’s exchange rate.
4.2 Robustness Testing
An important part of the research is to assess the robustness
of the tests and statistical methods that were employed to
assess the integrity of the results. This section aims to
challenge the robustness of the results obtained and the
methods used in the research to obtain those results.
The first and probably most critical assessment to be
made with regards to the robustness of the results is the ttest. Despite the clear depiction of the results from Fig. 1.3,
which display prominent and quite relevant negative
abnormal returns using both models, the t-statistic needs to
be critically assessed to evaluate the statistical integrity of
these results. The t-test is the most favoured approach when
assessing the statistical significance of data in an event
study, yet some academics believe it has been subjected to
misinterpretation and has been misused. Some journals have
gone as far as claiming that statistical significance based
classifications should not be used. Nevertheless, when not
Event Days
CAR on day 0 (MM)
CAR on day 0 (MV)
24 June 2016 & 27 June 2016
-0.0973 (7.6432)*
-0.0924 (3.3842)*
Fig. 1.3 Value of the CAR for both models. Notes The figures in brackets represent the t-test values, where *, ** and, *** respectively, represent
significance at 1, 5 and 10%. MM represents the market model and MV represents the mean average
Fig. 1.4 Abnormal returns for
both models. AR it MM represents
the abnormal returns from the
market model. AR i t MV
represents the abnormal returns
from the mean average returns
model
234
J. Janjusevic and W. Chegeni