

ability to statistically represent and measure the proposed
relationship between the research dependent and independent variable. Then, the next step is to present and discuss
more specific inferential results about the variables composing each model, as presented in Table 5, that will be
discussed as follows.
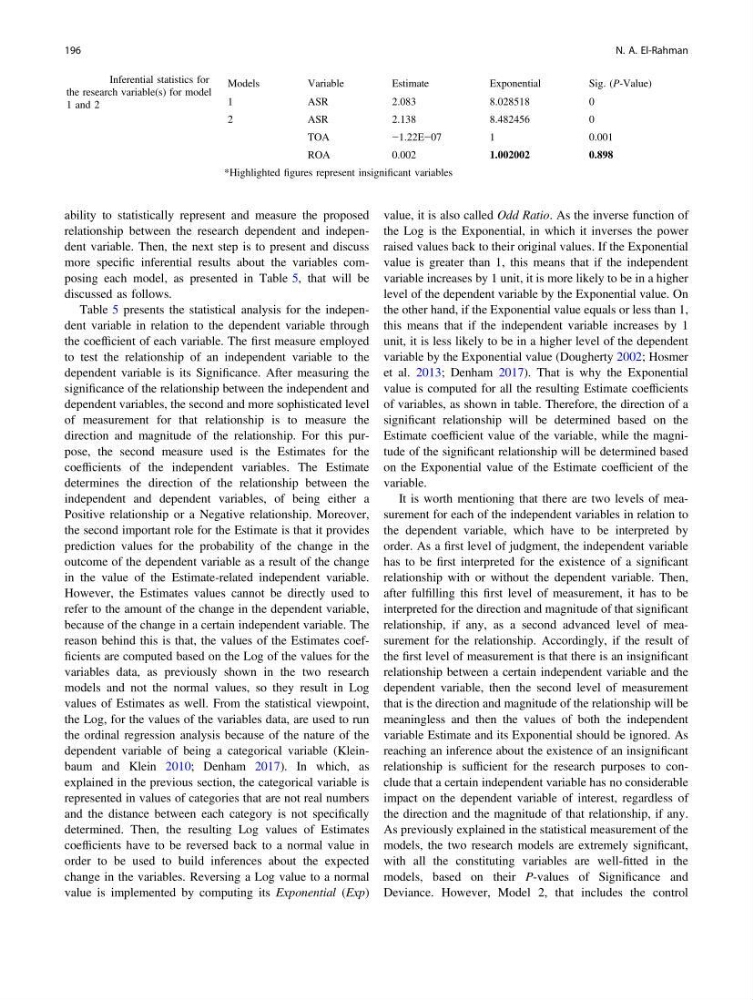
Table 5 presents the statistical analysis for the independent variable in relation to the dependent variable through
the coefficient of each variable. The first measure employed
to test the relationship of an independent variable to the
dependent variable is its Significance. After measuring the
significance of the relationship between the independent and
dependent variables, the second and more sophisticated level
of measurement for that relationship is to measure the
direction and magnitude of the relationship. For this purpose, the second measure used is the Estimates for the
coefficients of the independent variables. The Estimate
determines the direction of the relationship between the
independent and dependent variables, of being either a
Positive relationship or a Negative relationship. Moreover,
the second important role for the Estimate is that it provides
prediction values for the probability of the change in the
outcome of the dependent variable as a result of the change
in the value of the Estimate-related independent variable.
However, the Estimates values cannot be directly used to
refer to the amount of the change in the dependent variable,
because of the change in a certain independent variable. The
reason behind this is that, the values of the Estimates coefficients are computed based on the Log of the values for the
variables data, as previously shown in the two research
models and not the normal values, so they result in Log
values of Estimates as well. From the statistical viewpoint,
the Log, for the values of the variables data, are used to run
the ordinal regression analysis because of the nature of the
dependent variable of being a categorical variable (Kleinbaum and Klein 2010; Denham 2017). In which, as
explained in the previous section, the categorical variable is
represented in values of categories that are not real numbers
and the distance between each category is not specifically
determined. Then, the resulting Log values of Estimates
coefficients have to be reversed back to a normal value in
order to be used to build inferences about the expected
change in the variables. Reversing a Log value to a normal
value is implemented by computing its Exponential (Exp)
value, it is also called Odd Ratio. As the inverse function of
the Log is the Exponential, in which it inverses the power
raised values back to their original values. If the Exponential
value is greater than 1, this means that if the independent
variable increases by 1 unit, it is more likely to be in a higher
level of the dependent variable by the Exponential value. On
the other hand, if the Exponential value equals or less than 1,
this means that if the independent variable increases by 1
unit, it is less likely to be in a higher level of the dependent
variable by the Exponential value (Dougherty 2002; Hosmer
et al. 2013; Denham 2017). That is why the Exponential
value is computed for all the resulting Estimate coefficients
of variables, as shown in table. Therefore, the direction of a
significant relationship will be determined based on the
Estimate coefficient value of the variable, while the magnitude of the significant relationship will be determined based
on the Exponential value of the Estimate coefficient of the
variable.
It is worth mentioning that there are two levels of measurement for each of the independent variables in relation to
the dependent variable, which have to be interpreted by
order. As a first level of judgment, the independent variable
has to be first interpreted for the existence of a significant
relationship with or without the dependent variable. Then,
after fulfilling this first level of measurement, it has to be
interpreted for the direction and magnitude of that significant
relationship, if any, as a second advanced level of measurement for the relationship. Accordingly, if the result of
the first level of measurement is that there is an insignificant
relationship between a certain independent variable and the
dependent variable, then the second level of measurement
that is the direction and magnitude of the relationship will be
meaningless and then the values of both the independent
variable Estimate and its Exponential should be ignored. As
reaching an inference about the existence of an insignificant
relationship is sufficient for the research purposes to conclude that a certain independent variable has no considerable
impact on the dependent variable of interest, regardless of
the direction and the magnitude of that relationship, if any.
As previously explained in the statistical measurement of the
models, the two research models are extremely significant,
with all the constituting variables are well-fitted in the
models, based on their P-values of Significance and
Deviance. However, Model 2, that includes the control
Table 5 Inferential statistics for
the research variable(s) for model
1 and 2
Models
Variable
Estimate
Exponential
Sig. (P-Value)
1
ASR
2.083
8.028518
0
2
ASR
2.138
8.482456
0
TOA
−1.22E−07
1
0.001
ROA
0.002
1.002002
0.898
*Highlighted figures represent insignificant variables
196
N. A. El-Rahman
relationship between the research dependent and independent variable. Then, the next step is to present and discuss
more specific inferential results about the variables composing each model, as presented in Table 5, that will be
discussed as follows.
Table 5 presents the statistical analysis for the independent variable in relation to the dependent variable through
the coefficient of each variable. The first measure employed
to test the relationship of an independent variable to the
dependent variable is its Significance. After measuring the
significance of the relationship between the independent and
dependent variables, the second and more sophisticated level
of measurement for that relationship is to measure the
direction and magnitude of the relationship. For this purpose, the second measure used is the Estimates for the
coefficients of the independent variables. The Estimate
determines the direction of the relationship between the
independent and dependent variables, of being either a
Positive relationship or a Negative relationship. Moreover,
the second important role for the Estimate is that it provides
prediction values for the probability of the change in the
outcome of the dependent variable as a result of the change
in the value of the Estimate-related independent variable.
However, the Estimates values cannot be directly used to
refer to the amount of the change in the dependent variable,
because of the change in a certain independent variable. The
reason behind this is that, the values of the Estimates coefficients are computed based on the Log of the values for the
variables data, as previously shown in the two research
models and not the normal values, so they result in Log
values of Estimates as well. From the statistical viewpoint,
the Log, for the values of the variables data, are used to run
the ordinal regression analysis because of the nature of the
dependent variable of being a categorical variable (Kleinbaum and Klein 2010; Denham 2017). In which, as
explained in the previous section, the categorical variable is
represented in values of categories that are not real numbers
and the distance between each category is not specifically
determined. Then, the resulting Log values of Estimates
coefficients have to be reversed back to a normal value in
order to be used to build inferences about the expected
change in the variables. Reversing a Log value to a normal
value is implemented by computing its Exponential (Exp)
value, it is also called Odd Ratio. As the inverse function of
the Log is the Exponential, in which it inverses the power
raised values back to their original values. If the Exponential
value is greater than 1, this means that if the independent
variable increases by 1 unit, it is more likely to be in a higher
level of the dependent variable by the Exponential value. On
the other hand, if the Exponential value equals or less than 1,
this means that if the independent variable increases by 1
unit, it is less likely to be in a higher level of the dependent
variable by the Exponential value (Dougherty 2002; Hosmer
et al. 2013; Denham 2017). That is why the Exponential
value is computed for all the resulting Estimate coefficients
of variables, as shown in table. Therefore, the direction of a
significant relationship will be determined based on the
Estimate coefficient value of the variable, while the magnitude of the significant relationship will be determined based
on the Exponential value of the Estimate coefficient of the
variable.
It is worth mentioning that there are two levels of measurement for each of the independent variables in relation to
the dependent variable, which have to be interpreted by
order. As a first level of judgment, the independent variable
has to be first interpreted for the existence of a significant
relationship with or without the dependent variable. Then,
after fulfilling this first level of measurement, it has to be
interpreted for the direction and magnitude of that significant
relationship, if any, as a second advanced level of measurement for the relationship. Accordingly, if the result of
the first level of measurement is that there is an insignificant
relationship between a certain independent variable and the
dependent variable, then the second level of measurement
that is the direction and magnitude of the relationship will be
meaningless and then the values of both the independent
variable Estimate and its Exponential should be ignored. As
reaching an inference about the existence of an insignificant
relationship is sufficient for the research purposes to conclude that a certain independent variable has no considerable
impact on the dependent variable of interest, regardless of
the direction and the magnitude of that relationship, if any.
As previously explained in the statistical measurement of the
models, the two research models are extremely significant,
with all the constituting variables are well-fitted in the
models, based on their P-values of Significance and
Deviance. However, Model 2, that includes the control
Table 5 Inferential statistics for
the research variable(s) for model
1 and 2
Models
Variable
Estimate
Exponential
Sig. (P-Value)
1
ASR
2.083
8.028518
0
2
ASR
2.138
8.482456
0
TOA
−1.22E−07
1
0.001
ROA
0.002
1.002002
0.898
*Highlighted figures represent insignificant variables
196
N. A. El-Rahman