

Dependent variable (QSR) and the Independent variables,
(ASR), without including the Control variables. Model 2
includes the same Dependent variable and Independent
variables of Model 1, in addition to the Control variables,
(TOA) and (ROA), to test the impact of the control variables
on the model, if any.
Model 1:
Logit QSR = a þ bASR
Model 2:
Logit QSR = a þ b1ASR + b2TOA + b3ROA
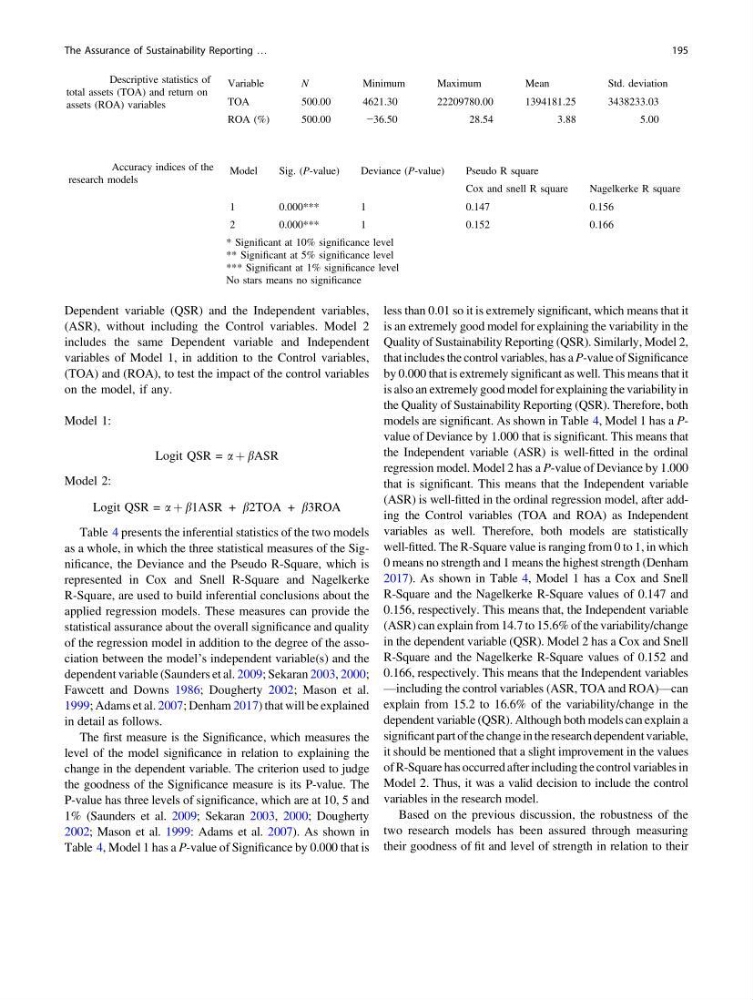
Table 4 presents the inferential statistics of the two models
as a whole, in which the three statistical measures of the Significance, the Deviance and the Pseudo R-Square, which is
represented in Cox and Snell R-Square and Nagelkerke
R-Square, are used to build inferential conclusions about the
applied regression models. These measures can provide the
statistical assurance about the overall significance and quality
of the regression model in addition to the degree of the association between the model’s independent variable(s) and the
dependent variable (Saunders et al. 2009; Sekaran 2003, 2000;
Fawcett and Downs 1986; Dougherty 2002; Mason et al.
1999; Adams et al. 2007; Denham 2017) that will be explained
in detail as follows.
The first measure is the Significance, which measures the
level of the model significance in relation to explaining the
change in the dependent variable. The criterion used to judge
the goodness of the Significance measure is its P-value. The
P-value has three levels of significance, which are at 10, 5 and
1% (Saunders et al. 2009; Sekaran 2003, 2000; Dougherty
2002; Mason et al. 1999: Adams et al. 2007). As shown in
Table 4, Model 1 has a P-value of Significance by 0.000 that is
less than 0.01 so it is extremely significant, which means that it
is an extremely good model for explaining the variability in the
Quality of Sustainability Reporting (QSR). Similarly, Model 2,
that includes the control variables, has a P-value of Significance
by 0.000 that is extremely significant as well. This means that it
is also an extremely good model for explaining the variability in
the Quality of Sustainability Reporting (QSR). Therefore, both
models are significant. As shown in Table 4, Model 1 has a Pvalue of Deviance by 1.000 that is significant. This means that
the Independent variable (ASR) is well-fitted in the ordinal
regression model. Model 2 has a P-value of Deviance by 1.000
that is significant. This means that the Independent variable
(ASR) is well-fitted in the ordinal regression model, after adding the Control variables (TOA and ROA) as Independent
variables as well. Therefore, both models are statistically
well-fitted. The R-Square value is ranging from 0 to 1, in which
0 means no strength and 1 means the highest strength (Denham
2017). As shown in Table 4, Model 1 has a Cox and Snell
R-Square and the Nagelkerke R-Square values of 0.147 and
0.156, respectively. This means that, the Independent variable
(ASR) can explain from 14.7 to 15.6% of the variability/change
in the dependent variable (QSR). Model 2 has a Cox and Snell
R-Square and the Nagelkerke R-Square values of 0.152 and
0.166, respectively. This means that the Independent variables
—including the control variables (ASR, TOA and ROA)—can
explain from 15.2 to 16.6% of the variability/change in the
dependent variable (QSR). Although both models can explain a
significant part of the change in the research dependent variable,
it should be mentioned that a slight improvement in the values
of R-Square has occurred after including the control variables in
Model 2. Thus, it was a valid decision to include the control
variables in the research model.
Based on the previous discussion, the robustness of the
two research models has been assured through measuring
their goodness of fit and level of strength in relation to their
Table 3 Descriptive statistics of
total assets (TOA) and return on
assets (ROA) variables
Variable
N
Minimum
Maximum
Mean
Std. deviation
TOA
500.00
4621.30
22209780.00
1394181.25
3438233.03
ROA (%)
500.00
−36.50
28.54
3.88
5.00
Table 4 Accuracy indices of the
research models
Model
Sig. (P-value)
Deviance (P-value)
Pseudo R square
Cox and snell R square
Nagelkerke R square
1
0.000***
1
0.147
0.156
2
0.000***
1
0.152
0.166
* Significant at 10% significance level
** Significant at 5% significance level
*** Significant at 1% significance level
No stars means no significance
The Assurance of Sustainability Reporting …
195
(ASR), without including the Control variables. Model 2
includes the same Dependent variable and Independent
variables of Model 1, in addition to the Control variables,
(TOA) and (ROA), to test the impact of the control variables
on the model, if any.
Model 1:
Logit QSR = a þ bASR
Model 2:
Logit QSR = a þ b1ASR + b2TOA + b3ROA
Table 4 presents the inferential statistics of the two models
as a whole, in which the three statistical measures of the Significance, the Deviance and the Pseudo R-Square, which is
represented in Cox and Snell R-Square and Nagelkerke
R-Square, are used to build inferential conclusions about the
applied regression models. These measures can provide the
statistical assurance about the overall significance and quality
of the regression model in addition to the degree of the association between the model’s independent variable(s) and the
dependent variable (Saunders et al. 2009; Sekaran 2003, 2000;
Fawcett and Downs 1986; Dougherty 2002; Mason et al.
1999; Adams et al. 2007; Denham 2017) that will be explained
in detail as follows.
The first measure is the Significance, which measures the
level of the model significance in relation to explaining the
change in the dependent variable. The criterion used to judge
the goodness of the Significance measure is its P-value. The
P-value has three levels of significance, which are at 10, 5 and
1% (Saunders et al. 2009; Sekaran 2003, 2000; Dougherty
2002; Mason et al. 1999: Adams et al. 2007). As shown in
Table 4, Model 1 has a P-value of Significance by 0.000 that is
less than 0.01 so it is extremely significant, which means that it
is an extremely good model for explaining the variability in the
Quality of Sustainability Reporting (QSR). Similarly, Model 2,
that includes the control variables, has a P-value of Significance
by 0.000 that is extremely significant as well. This means that it
is also an extremely good model for explaining the variability in
the Quality of Sustainability Reporting (QSR). Therefore, both
models are significant. As shown in Table 4, Model 1 has a Pvalue of Deviance by 1.000 that is significant. This means that
the Independent variable (ASR) is well-fitted in the ordinal
regression model. Model 2 has a P-value of Deviance by 1.000
that is significant. This means that the Independent variable
(ASR) is well-fitted in the ordinal regression model, after adding the Control variables (TOA and ROA) as Independent
variables as well. Therefore, both models are statistically
well-fitted. The R-Square value is ranging from 0 to 1, in which
0 means no strength and 1 means the highest strength (Denham
2017). As shown in Table 4, Model 1 has a Cox and Snell
R-Square and the Nagelkerke R-Square values of 0.147 and
0.156, respectively. This means that, the Independent variable
(ASR) can explain from 14.7 to 15.6% of the variability/change
in the dependent variable (QSR). Model 2 has a Cox and Snell
R-Square and the Nagelkerke R-Square values of 0.152 and
0.166, respectively. This means that the Independent variables
—including the control variables (ASR, TOA and ROA)—can
explain from 15.2 to 16.6% of the variability/change in the
dependent variable (QSR). Although both models can explain a
significant part of the change in the research dependent variable,
it should be mentioned that a slight improvement in the values
of R-Square has occurred after including the control variables in
Model 2. Thus, it was a valid decision to include the control
variables in the research model.
Based on the previous discussion, the robustness of the
two research models has been assured through measuring
their goodness of fit and level of strength in relation to their
Table 3 Descriptive statistics of
total assets (TOA) and return on
assets (ROA) variables
Variable
N
Minimum
Maximum
Mean
Std. deviation
TOA
500.00
4621.30
22209780.00
1394181.25
3438233.03
ROA (%)
500.00
−36.50
28.54
3.88
5.00
Table 4 Accuracy indices of the
research models
Model
Sig. (P-value)
Deviance (P-value)
Pseudo R square
Cox and snell R square
Nagelkerke R square
1
0.000***
1
0.147
0.156
2
0.000***
1
0.152
0.166
* Significant at 10% significance level
** Significant at 5% significance level
*** Significant at 1% significance level
No stars means no significance
The Assurance of Sustainability Reporting …
195