

(inclusive), for the 100 companies, so that research data are
collected and tested for 500 reports. Consequently, it is
envisaged that no data will be collected from private sources;
therefore, no ethical issues should arise in terms of data
collection and analysis.
7 Empirical Results and Discussion
The Statistical Package for the Social Sciences (SPSS) is
employed to implement the statistical analysis for the collected data. SPSS is considered as the most popular and
user-friendly statistical analysis software package. It can run
descriptive statistics as well as sophisticated inferential
statistics (Punch 2014; Sekaran 2003; Adams et al. 2007).
Then, the statistical results are divided into the two categories of Descriptive results and Inferential results, as
follows.
Discussion of Descriptive Results:
The first step in presenting and reporting the results of the
statistical analysis process is to describe and summarize the
results, which are called the Descriptive Results. Since the
research variables are divided into two categories, Categorical and Continuous variables (as explained in the previous
section), the descriptive results for the variables are divided
into two categories as well (Comyns et al. 2013; Nobanee
and Ellili 2016; Latridis 2013; Gray et al. 1993; Hubbard
2011; Hinton and McMurray 2017; Hooks and Staden 2011;
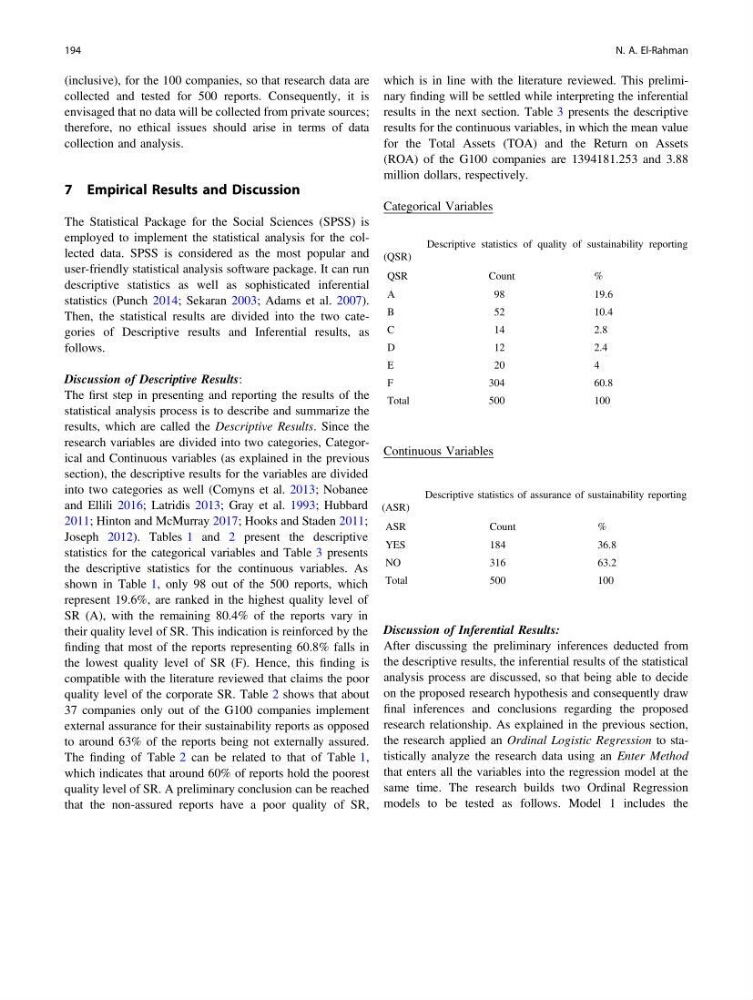
Joseph 2012). Tables 1 and 2 present the descriptive
statistics for the categorical variables and Table 3 presents
the descriptive statistics for the continuous variables. As
shown in Table 1, only 98 out of the 500 reports, which
represent 19.6%, are ranked in the highest quality level of
SR (A), with the remaining 80.4% of the reports vary in
their quality level of SR. This indication is reinforced by the
finding that most of the reports representing 60.8% falls in
the lowest quality level of SR (F). Hence, this finding is
compatible with the literature reviewed that claims the poor
quality level of the corporate SR. Table 2 shows that about
37 companies only out of the G100 companies implement
external assurance for their sustainability reports as opposed
to around 63% of the reports being not externally assured.
The finding of Table 2 can be related to that of Table 1,
which indicates that around 60% of reports hold the poorest
quality level of SR. A preliminary conclusion can be reached
that the non-assured reports have a poor quality of SR,
which is in line with the literature reviewed. This preliminary finding will be settled while interpreting the inferential
results in the next section. Table 3 presents the descriptive
results for the continuous variables, in which the mean value
for the Total Assets (TOA) and the Return on Assets
(ROA) of the G100 companies are 1394181.253 and 3.88
million dollars, respectively.
Categorical Variables
Continuous Variables
Discussion of Inferential Results:
After discussing the preliminary inferences deducted from
the descriptive results, the inferential results of the statistical
analysis process are discussed, so that being able to decide
on the proposed research hypothesis and consequently draw
final inferences and conclusions regarding the proposed
research relationship. As explained in the previous section,
the research applied an Ordinal Logistic Regression to statistically analyze the research data using an Enter Method
that enters all the variables into the regression model at the
same time. The research builds two Ordinal Regression
models to be tested as follows. Model 1 includes the
Table 1 Descriptive statistics of quality of sustainability reporting
(QSR)
QSR
Count
%
A
98
19.6
B
52
10.4
C
14
2.8
D
12
2.4
E
2 0
4
F
304
60.8
Total
500
100
Table 2 Descriptive statistics of assurance of sustainability reporting
(ASR)
ASR
Count
%
YES
184
36.8
NO
316
63.2
Total
500
100
194
N. A. El-Rahman
collected and tested for 500 reports. Consequently, it is
envisaged that no data will be collected from private sources;
therefore, no ethical issues should arise in terms of data
collection and analysis.
7 Empirical Results and Discussion
The Statistical Package for the Social Sciences (SPSS) is
employed to implement the statistical analysis for the collected data. SPSS is considered as the most popular and
user-friendly statistical analysis software package. It can run
descriptive statistics as well as sophisticated inferential
statistics (Punch 2014; Sekaran 2003; Adams et al. 2007).
Then, the statistical results are divided into the two categories of Descriptive results and Inferential results, as
follows.
Discussion of Descriptive Results:
The first step in presenting and reporting the results of the
statistical analysis process is to describe and summarize the
results, which are called the Descriptive Results. Since the
research variables are divided into two categories, Categorical and Continuous variables (as explained in the previous
section), the descriptive results for the variables are divided
into two categories as well (Comyns et al. 2013; Nobanee
and Ellili 2016; Latridis 2013; Gray et al. 1993; Hubbard
2011; Hinton and McMurray 2017; Hooks and Staden 2011;
Joseph 2012). Tables 1 and 2 present the descriptive
statistics for the categorical variables and Table 3 presents
the descriptive statistics for the continuous variables. As
shown in Table 1, only 98 out of the 500 reports, which
represent 19.6%, are ranked in the highest quality level of
SR (A), with the remaining 80.4% of the reports vary in
their quality level of SR. This indication is reinforced by the
finding that most of the reports representing 60.8% falls in
the lowest quality level of SR (F). Hence, this finding is
compatible with the literature reviewed that claims the poor
quality level of the corporate SR. Table 2 shows that about
37 companies only out of the G100 companies implement
external assurance for their sustainability reports as opposed
to around 63% of the reports being not externally assured.
The finding of Table 2 can be related to that of Table 1,
which indicates that around 60% of reports hold the poorest
quality level of SR. A preliminary conclusion can be reached
that the non-assured reports have a poor quality of SR,
which is in line with the literature reviewed. This preliminary finding will be settled while interpreting the inferential
results in the next section. Table 3 presents the descriptive
results for the continuous variables, in which the mean value
for the Total Assets (TOA) and the Return on Assets
(ROA) of the G100 companies are 1394181.253 and 3.88
million dollars, respectively.
Categorical Variables
Continuous Variables
Discussion of Inferential Results:
After discussing the preliminary inferences deducted from
the descriptive results, the inferential results of the statistical
analysis process are discussed, so that being able to decide
on the proposed research hypothesis and consequently draw
final inferences and conclusions regarding the proposed
research relationship. As explained in the previous section,
the research applied an Ordinal Logistic Regression to statistically analyze the research data using an Enter Method
that enters all the variables into the regression model at the
same time. The research builds two Ordinal Regression
models to be tested as follows. Model 1 includes the
Table 1 Descriptive statistics of quality of sustainability reporting
(QSR)
QSR
Count
%
A
98
19.6
B
52
10.4
C
14
2.8
D
12
2.4
E
2 0
4
F
304
60.8
Total
500
100
Table 2 Descriptive statistics of assurance of sustainability reporting
(ASR)
ASR
Count
%
YES
184
36.8
NO
316
63.2
Total
500
100
194
N. A. El-Rahman