

54
4 An Innovative Measurement Instrument …
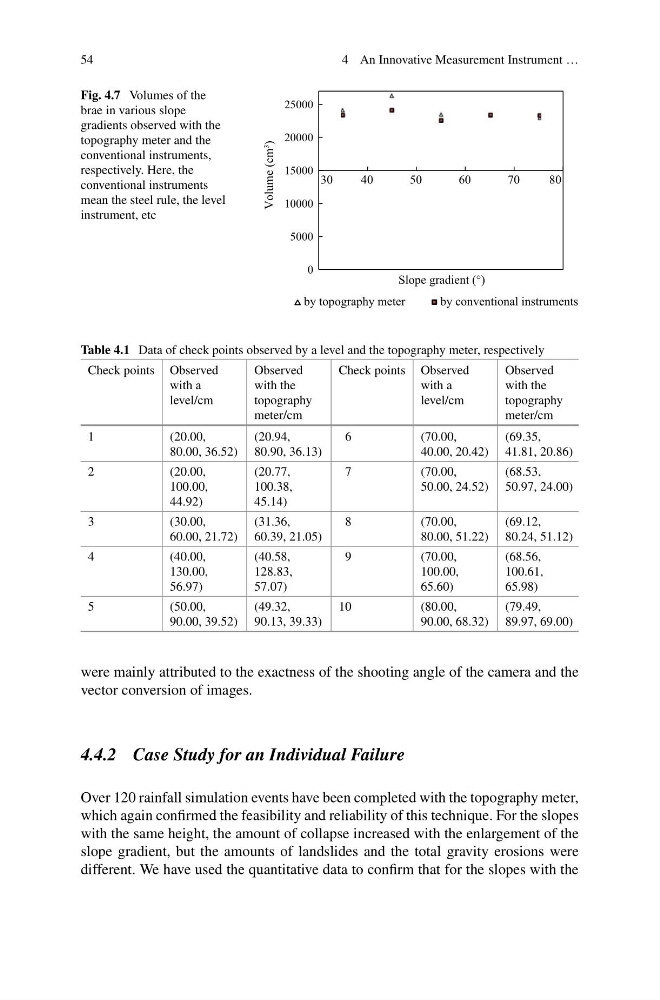
Fig. 4.7 Volumes of the
brae in various slope
gradients observed with the
topography meter and the
conventional instruments,
respectively. Here, the
conventional instruments
mean the steel rule, the level
instrument, etc
0
5000
10000
15000
20000
25000
30
40
50
60
70
80
Volume (cm
3
)
Slope gradient (°)
by topography meter
by conventional instruments
Table 4.1 Data of check points observed by a level and the topography meter, respectively
Check points Observed
with a
level/cm
Observed
with the
topography
meter/cm
Check points Observed
with a
level/cm
Observed
with the
topography
meter/cm
1
(20.00,
80.00, 36.52)
(20.94,
80.90, 36.13)
6
(70.00,
40.00, 20.42)
(69.35,
41.81, 20.86)
2
(20.00,
100.00,
44.92)
(20.77,
100.38,
45.14)
7
(70.00,
50.00, 24.52)
(68.53,
50.97, 24.00)
3
(30.00,
60.00, 21.72)
(31.36,
60.39, 21.05)
8
(70.00,
80.00, 51.22)
(69.12,
80.24, 51.12)
4
(40.00,
130.00,
56.97)
(40.58,
128.83,
57.07)
9
(70.00,
100.00,
65.60)
(68.56,
100.61,
65.98)
5
(50.00,
90.00, 39.52)
(49.32,
90.13, 39.33)
10
(80.00,
90.00, 68.32)
(79.49,
89.97, 69.00)
were mainly attributed to the exactness of the shooting angle of the camera and the
vector conversion of images.
4.4.2 Case Study for an Individual Failure
Over 120 rainfall simulation events have been completed with the topography meter,
which again confirmed the feasibility and reliability of this technique. For the slopes
with the same height, the amount of collapse increased with the enlargement of the
slope gradient, but the amounts of landslides and the total gravity erosions were
different. We have used the quantitative data to confirm that for the slopes with the
4 An Innovative Measurement Instrument …
Fig. 4.7 Volumes of the
brae in various slope
gradients observed with the
topography meter and the
conventional instruments,
respectively. Here, the
conventional instruments
mean the steel rule, the level
instrument, etc
0
5000
10000
15000
20000
25000
30
40
50
60
70
80
Volume (cm
3
)
Slope gradient (°)
by topography meter
by conventional instruments
Table 4.1 Data of check points observed by a level and the topography meter, respectively
Check points Observed
with a
level/cm
Observed
with the
topography
meter/cm
Check points Observed
with a
level/cm
Observed
with the
topography
meter/cm
1
(20.00,
80.00, 36.52)
(20.94,
80.90, 36.13)
6
(70.00,
40.00, 20.42)
(69.35,
41.81, 20.86)
2
(20.00,
100.00,
44.92)
(20.77,
100.38,
45.14)
7
(70.00,
50.00, 24.52)
(68.53,
50.97, 24.00)
3
(30.00,
60.00, 21.72)
(31.36,
60.39, 21.05)
8
(70.00,
80.00, 51.22)
(69.12,
80.24, 51.12)
4
(40.00,
130.00,
56.97)
(40.58,
128.83,
57.07)
9
(70.00,
100.00,
65.60)
(68.56,
100.61,
65.98)
5
(50.00,
90.00, 39.52)
(49.32,
90.13, 39.33)
10
(80.00,
90.00, 68.32)
(79.49,
89.97, 69.00)
were mainly attributed to the exactness of the shooting angle of the camera and the
vector conversion of images.
4.4.2 Case Study for an Individual Failure
Over 120 rainfall simulation events have been completed with the topography meter,
which again confirmed the feasibility and reliability of this technique. For the slopes
with the same height, the amount of collapse increased with the enlargement of the
slope gradient, but the amounts of landslides and the total gravity erosions were
different. We have used the quantitative data to confirm that for the slopes with the