

4.4 Results and Discussion
55
same slope gradient, the amount of collapse increased with the enlargement of the
slope height, but the amounts of landslides were different (Xu and Zhao 2014). We
also counted the ratio of the gravity erosion to the total slope erosion, and affirmed
that gravity erosion is more dangerous than hydraulic erosion on the steep loess
slope, as briefly shown in the following text. All results seem rational and reliable.
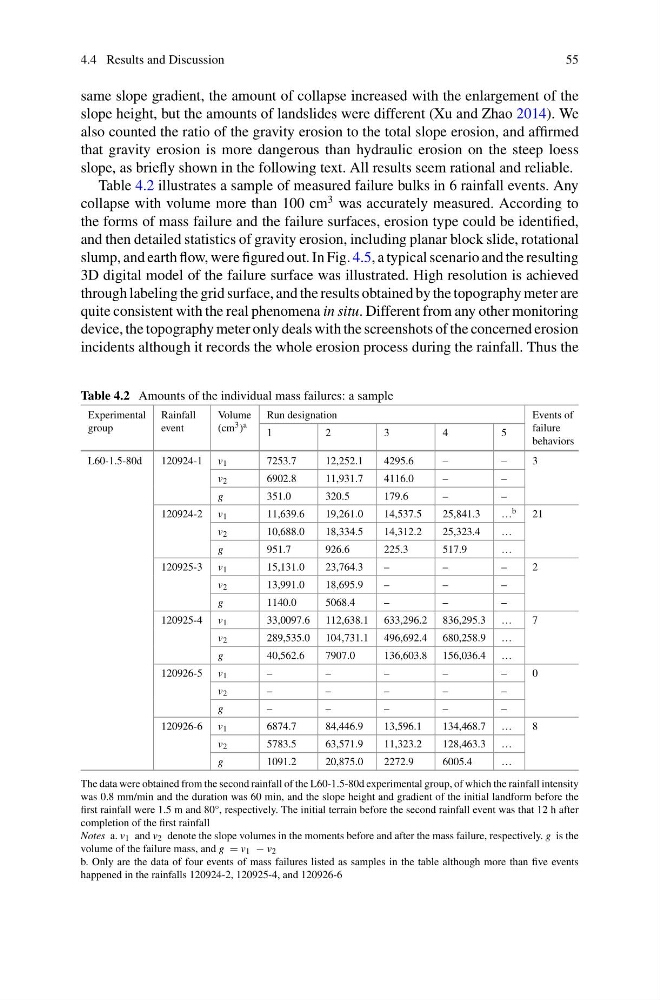
Table 4.2 illustrates a sample of measured failure bulks in 6 rainfall events. Any
collapse with volume more than 100 cm
3 was accurately measured. According to
the forms of mass failure and the failure surfaces, erosion type could be identified,
and then detailed statistics of gravity erosion, including planar block slide, rotational
slump, and earth flow, were figured out. In Fig. 4.5, a typical scenario and the resulting
3D digital model of the failure surface was illustrated. High resolution is achieved
through labeling the grid surface, and the results obtained by the topography meter are
quite consistent with the real phenomena in situ. Different from any other monitoring
device, the topography meter only deals with the screenshots of the concerned erosion
incidents although it records the whole erosion process during the rainfall. Thus the
Table 4.2 Amounts of the individual mass failures: a sample
Experimental
group
Rainfall
event
Volume
(cm 3 ) a
Run designation
Events of
failure
behaviors
1
2
3
4
5
L60-1.5-80d
120924-1 v 1
7253.7
12,252.1
4295.6
–
–
3
v 2
6902.8
11,931.7
4116.0
–
–
g
351.0
320.5
179.6
–
–
120924-2 v 1
11,639.6
19,261.0
14,537.5
25,841.3
… b
21
v 2
10,688.0
18,334.5
14,312.2
25,323.4
…
g
951.7
926.6
225.3
517.9
…
120925-3 v 1
15,131.0
23,764.3
–
–
–
2
v 2
13,991.0
18,695.9
–
–
–
g
1140.0
5068.4
–
–
–
120925-4 v 1
33,0097.6 112,638.1 633,296.2 836,295.3 …
7
v 2
289,535.0 104,731.1 496,692.4 680,258.9 …
g
40,562.6
7907.0
136,603.8 156,036.4 …
120926-5 v 1
–
–
–
–
–
0
v 2
–
–
–
–
–
g
–
–
–
–
–
120926-6 v 1
6874.7
84,446.9
13,596.1
134,468.7 …
8
v 2
5783.5
63,571.9
11,323.2
128,463.3 …
g
1091.2
20,875.0
2272.9
6005.4
…
The data were obtained from the second rainfall of the L60-1.5-80d experimental group, of which the rainfall intensity
was 0.8 mm/min and the duration was 60 min, and the slope height and gradient of the initial landform before the
first rainfall were 1.5 m and 80°, respectively. The initial terrain before the second rainfall event was that 12 h after
completion of the first rainfall
Notes a. v 1 and v 2 denote the slope volumes in the moments before and after the mass failure, respectively. g is the
volume of the failure mass, and g = v 1 − v 2
b. Only are the data of four events of mass failures listed as samples in the table although more than five events
happened in the rainfalls 120924-2, 120925-4, and 120926-6
55
same slope gradient, the amount of collapse increased with the enlargement of the
slope height, but the amounts of landslides were different (Xu and Zhao 2014). We
also counted the ratio of the gravity erosion to the total slope erosion, and affirmed
that gravity erosion is more dangerous than hydraulic erosion on the steep loess
slope, as briefly shown in the following text. All results seem rational and reliable.
Table 4.2 illustrates a sample of measured failure bulks in 6 rainfall events. Any
collapse with volume more than 100 cm
3 was accurately measured. According to
the forms of mass failure and the failure surfaces, erosion type could be identified,
and then detailed statistics of gravity erosion, including planar block slide, rotational
slump, and earth flow, were figured out. In Fig. 4.5, a typical scenario and the resulting
3D digital model of the failure surface was illustrated. High resolution is achieved
through labeling the grid surface, and the results obtained by the topography meter are
quite consistent with the real phenomena in situ. Different from any other monitoring
device, the topography meter only deals with the screenshots of the concerned erosion
incidents although it records the whole erosion process during the rainfall. Thus the
Table 4.2 Amounts of the individual mass failures: a sample
Experimental
group
Rainfall
event
Volume
(cm 3 ) a
Run designation
Events of
failure
behaviors
1
2
3
4
5
L60-1.5-80d
120924-1 v 1
7253.7
12,252.1
4295.6
–
–
3
v 2
6902.8
11,931.7
4116.0
–
–
g
351.0
320.5
179.6
–
–
120924-2 v 1
11,639.6
19,261.0
14,537.5
25,841.3
… b
21
v 2
10,688.0
18,334.5
14,312.2
25,323.4
…
g
951.7
926.6
225.3
517.9
…
120925-3 v 1
15,131.0
23,764.3
–
–
–
2
v 2
13,991.0
18,695.9
–
–
–
g
1140.0
5068.4
–
–
–
120925-4 v 1
33,0097.6 112,638.1 633,296.2 836,295.3 …
7
v 2
289,535.0 104,731.1 496,692.4 680,258.9 …
g
40,562.6
7907.0
136,603.8 156,036.4 …
120926-5 v 1
–
–
–
–
–
0
v 2
–
–
–
–
–
g
–
–
–
–
–
120926-6 v 1
6874.7
84,446.9
13,596.1
134,468.7 …
8
v 2
5783.5
63,571.9
11,323.2
128,463.3 …
g
1091.2
20,875.0
2272.9
6005.4
…
The data were obtained from the second rainfall of the L60-1.5-80d experimental group, of which the rainfall intensity
was 0.8 mm/min and the duration was 60 min, and the slope height and gradient of the initial landform before the
first rainfall were 1.5 m and 80°, respectively. The initial terrain before the second rainfall event was that 12 h after
completion of the first rainfall
Notes a. v 1 and v 2 denote the slope volumes in the moments before and after the mass failure, respectively. g is the
volume of the failure mass, and g = v 1 − v 2
b. Only are the data of four events of mass failures listed as samples in the table although more than five events
happened in the rainfalls 120924-2, 120925-4, and 120926-6