

4.4 Results and Discussion
53
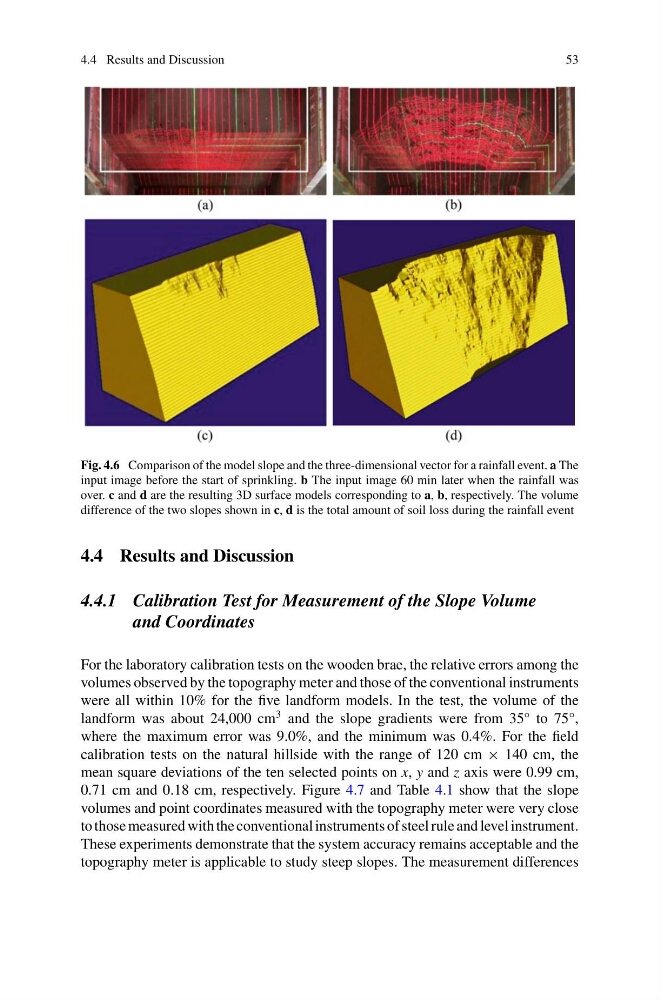
Fig. 4.6 Comparison of the model slope and the three-dimensional vector for a rainfall event. a The
input image before the start of sprinkling. b The input image 60 min later when the rainfall was
over. c and d are the resulting 3D surface models corresponding to a, b, respectively. The volume
difference of the two slopes shown in c, d is the total amount of soil loss during the rainfall event
4.4 Results and Discussion
4.4.1 Calibration Test for Measurement of the Slope Volume
and Coordinates
For the laboratory calibration tests on the wooden brae, the relative errors among the
volumes observed by the topography meter and those of the conventional instruments
were all within 10% for the five landform models. In the test, the volume of the
landform was about 24,000 cm
3 and the slope gradients were from 35° to 75°,
where the maximum error was 9.0%, and the minimum was 0.4%. For the field
calibration tests on the natural hillside with the range of 120 cm × 140 cm, the
mean square deviations of the ten selected points on x, y and z axis were 0.99 cm,
0.71 cm and 0.18 cm, respectively. Figure 4.7 and Table 4.1 show that the slope
volumes and point coordinates measured with the topography meter were very close
to those measured with the conventional instruments of steel rule and level instrument.
These experiments demonstrate that the system accuracy remains acceptable and the
topography meter is applicable to study steep slopes. The measurement differences
53
Fig. 4.6 Comparison of the model slope and the three-dimensional vector for a rainfall event. a The
input image before the start of sprinkling. b The input image 60 min later when the rainfall was
over. c and d are the resulting 3D surface models corresponding to a, b, respectively. The volume
difference of the two slopes shown in c, d is the total amount of soil loss during the rainfall event
4.4 Results and Discussion
4.4.1 Calibration Test for Measurement of the Slope Volume
and Coordinates
For the laboratory calibration tests on the wooden brae, the relative errors among the
volumes observed by the topography meter and those of the conventional instruments
were all within 10% for the five landform models. In the test, the volume of the
landform was about 24,000 cm
3 and the slope gradients were from 35° to 75°,
where the maximum error was 9.0%, and the minimum was 0.4%. For the field
calibration tests on the natural hillside with the range of 120 cm × 140 cm, the
mean square deviations of the ten selected points on x, y and z axis were 0.99 cm,
0.71 cm and 0.18 cm, respectively. Figure 4.7 and Table 4.1 show that the slope
volumes and point coordinates measured with the topography meter were very close
to those measured with the conventional instruments of steel rule and level instrument.
These experiments demonstrate that the system accuracy remains acceptable and the
topography meter is applicable to study steep slopes. The measurement differences