

52
4 An Innovative Measurement Instrument …
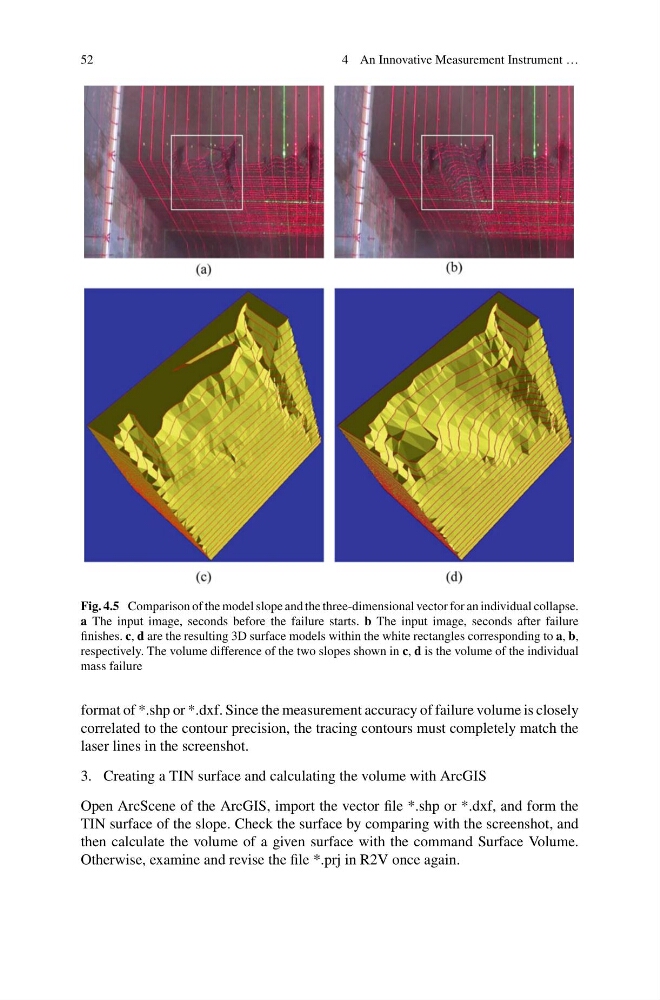
Fig. 4.5 Comparison of the model slope and the three-dimensional vector for an individual collapse.
a The input image, seconds before the failure starts. b The input image, seconds after failure
finishes. c, d are the resulting 3D surface models within the white rectangles corresponding to a, b,
respectively. The volume difference of the two slopes shown in c, d is the volume of the individual
mass failure
format of *.shp or *.dxf. Since the measurement accuracy of failure volume is closely
correlated to the contour precision, the tracing contours must completely match the
laser lines in the screenshot.
3. Creating a TIN surface and calculating the volume with ArcGIS
Open ArcScene of the ArcGIS, import the vector file *.shp or *.dxf, and form the
TIN surface of the slope. Check the surface by comparing with the screenshot, and
then calculate the volume of a given surface with the command Surface Volume.
Otherwise, examine and revise the file *.prj in R2V once again.
4 An Innovative Measurement Instrument …
Fig. 4.5 Comparison of the model slope and the three-dimensional vector for an individual collapse.
a The input image, seconds before the failure starts. b The input image, seconds after failure
finishes. c, d are the resulting 3D surface models within the white rectangles corresponding to a, b,
respectively. The volume difference of the two slopes shown in c, d is the volume of the individual
mass failure
format of *.shp or *.dxf. Since the measurement accuracy of failure volume is closely
correlated to the contour precision, the tracing contours must completely match the
laser lines in the screenshot.
3. Creating a TIN surface and calculating the volume with ArcGIS
Open ArcScene of the ArcGIS, import the vector file *.shp or *.dxf, and form the
TIN surface of the slope. Check the surface by comparing with the screenshot, and
then calculate the volume of a given surface with the command Surface Volume.
Otherwise, examine and revise the file *.prj in R2V once again.