

4.3 Data Processing
51
Get the video of the eroding
slope with the Topography Meter
Get the screenshot in QQ Video
and mark the failure scar in
Photoshop
Digitize the contours in R2V
Start
Contour trace
Input of control points
Assign of the contour elevations
Output of the file with a type of
*.shp or *.dxf
Check the contour data in R2V
Create, check and calculate the
3D surface in ArcScene
Comparison of the 3D model
with the screenshot
Volume calculation
Data check
End
True
True
False
False
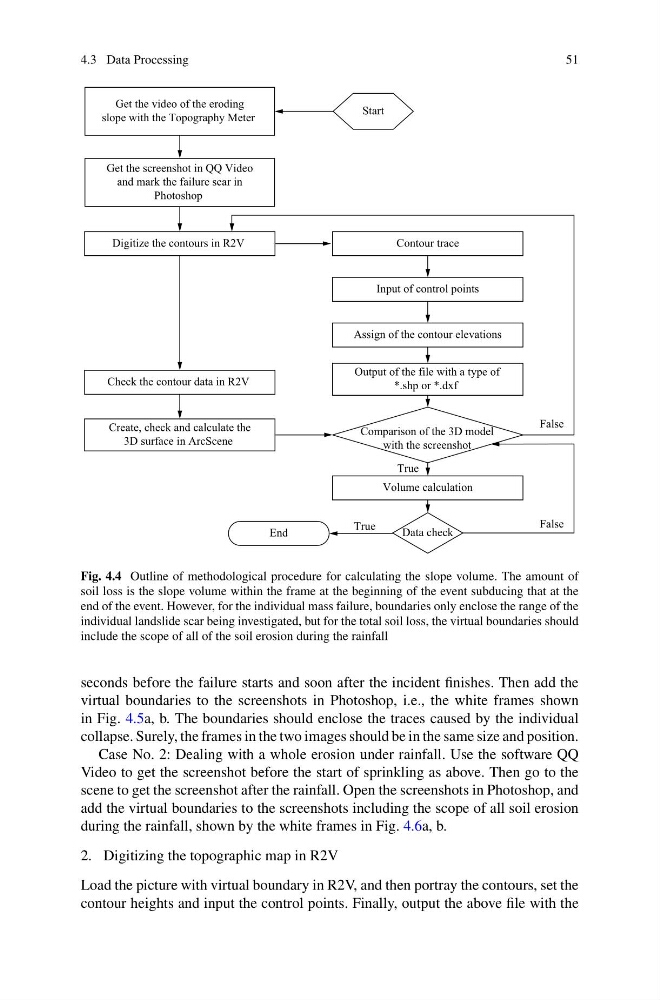
Fig. 4.4 Outline of methodological procedure for calculating the slope volume. The amount of
soil loss is the slope volume within the frame at the beginning of the event subducing that at the
end of the event. However, for the individual mass failure, boundaries only enclose the range of the
individual landslide scar being investigated, but for the total soil loss, the virtual boundaries should
include the scope of all of the soil erosion during the rainfall
seconds before the failure starts and soon after the incident finishes. Then add the
virtual boundaries to the screenshots in Photoshop, i.e., the white frames shown
in Fig. 4.5a, b. The boundaries should enclose the traces caused by the individual
collapse. Surely, the frames in the two images should be in the same size and position.
Case No. 2: Dealing with a whole erosion under rainfall. Use the software QQ
Video to get the screenshot before the start of sprinkling as above. Then go to the
scene to get the screenshot after the rainfall. Open the screenshots in Photoshop, and
add the virtual boundaries to the screenshots including the scope of all soil erosion
during the rainfall, shown by the white frames in Fig. 4.6a, b.
2. Digitizing the topographic map in R2V
Load the picture with virtual boundary in R2V, and then portray the contours, set the
contour heights and input the control points. Finally, output the above file with the
51
Get the video of the eroding
slope with the Topography Meter
Get the screenshot in QQ Video
and mark the failure scar in
Photoshop
Digitize the contours in R2V
Start
Contour trace
Input of control points
Assign of the contour elevations
Output of the file with a type of
*.shp or *.dxf
Check the contour data in R2V
Create, check and calculate the
3D surface in ArcScene
Comparison of the 3D model
with the screenshot
Volume calculation
Data check
End
True
True
False
False
Fig. 4.4 Outline of methodological procedure for calculating the slope volume. The amount of
soil loss is the slope volume within the frame at the beginning of the event subducing that at the
end of the event. However, for the individual mass failure, boundaries only enclose the range of the
individual landslide scar being investigated, but for the total soil loss, the virtual boundaries should
include the scope of all of the soil erosion during the rainfall
seconds before the failure starts and soon after the incident finishes. Then add the
virtual boundaries to the screenshots in Photoshop, i.e., the white frames shown
in Fig. 4.5a, b. The boundaries should enclose the traces caused by the individual
collapse. Surely, the frames in the two images should be in the same size and position.
Case No. 2: Dealing with a whole erosion under rainfall. Use the software QQ
Video to get the screenshot before the start of sprinkling as above. Then go to the
scene to get the screenshot after the rainfall. Open the screenshots in Photoshop, and
add the virtual boundaries to the screenshots including the scope of all soil erosion
during the rainfall, shown by the white frames in Fig. 4.6a, b.
2. Digitizing the topographic map in R2V
Load the picture with virtual boundary in R2V, and then portray the contours, set the
contour heights and input the control points. Finally, output the above file with the