

160
10 A Sensitivity Analysis on the Gravity …
Table 10.3 The maximum volume of a type of mass failure for an initial landform after five rainfalls
Experimental group
Peak of the individual failure events (10 3 cm 3 )
Avalanche
Landslide
Mudslide
WGE
G1 (L5–L8)
224.1
177.6
21.7
224.1
G2 (L1–L4)
369.9
168.4
24.6
369.9
G3 (L9–L10)
75.2
27.1
1.3
75.2
G4 (L5–L6)
60.7
177.6
21.7
177.6
G5 (L1, L3, L5, L7)
224.1
177.6
24.6
224.1
G6 (L2, L4, L6, L8)
369.9
168.4
7.2
369.9
G7 (L1, L2, L5, L6)
139.5
177.6
24.6
177.6
G8 (L3, L4, L7, L8)
369.9
156.0
12.8
369.9
High-magnitude failure events with the erosion amount more than 500 cm 3 were analyzed
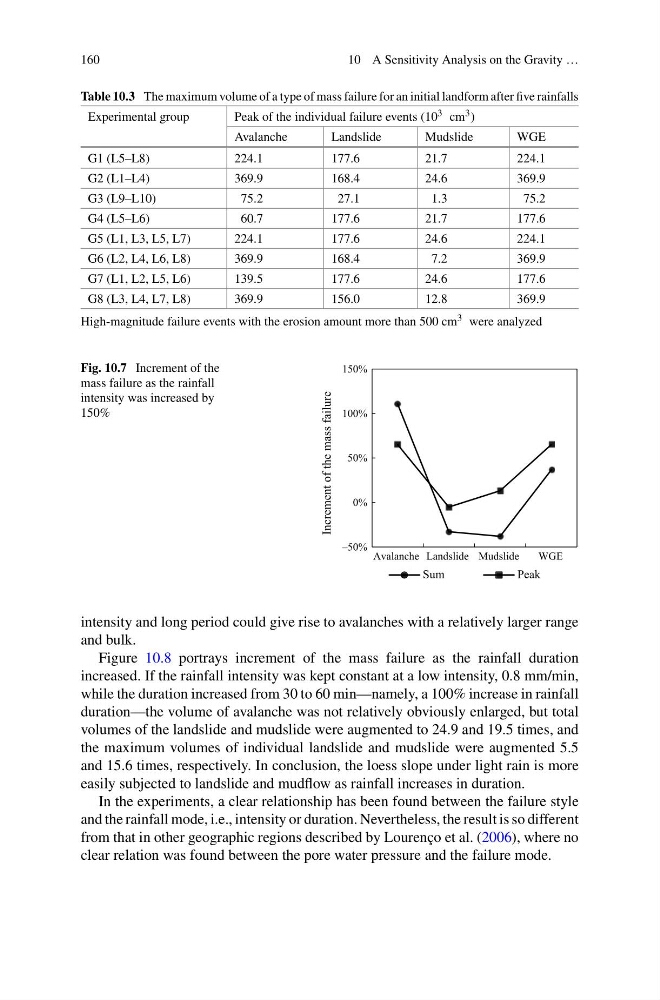
Fig. 10.7 Increment of the
mass failure as the rainfall
intensity was increased by
150%
–50%
0%
50%
100%
150%
Avalanche Landslide Mudslide
WGE
Increment of the mass failure
Sum
Peak
intensity and long period could give rise to avalanches with a relatively larger range
and bulk.
Figure 10.8 portrays increment of the mass failure as the rainfall duration
increased. If the rainfall intensity was kept constant at a low intensity, 0.8 mm/min,
while the duration increased from 30 to 60 min—namely, a 100% increase in rainfall
duration—the volume of avalanche was not relatively obviously enlarged, but total
volumes of the landslide and mudslide were augmented to 24.9 and 19.5 times, and
the maximum volumes of individual landslide and mudslide were augmented 5.5
and 15.6 times, respectively. In conclusion, the loess slope under light rain is more
easily subjected to landslide and mudflow as rainfall increases in duration.
In the experiments, a clear relationship has been found between the failure style
and the rainfall mode, i.e., intensity or duration. Nevertheless, the result is so different
from that in other geographic regions described by Lourenço et al. (2006), where no
clear relation was found between the pore water pressure and the failure mode.
10 A Sensitivity Analysis on the Gravity …
Table 10.3 The maximum volume of a type of mass failure for an initial landform after five rainfalls
Experimental group
Peak of the individual failure events (10 3 cm 3 )
Avalanche
Landslide
Mudslide
WGE
G1 (L5–L8)
224.1
177.6
21.7
224.1
G2 (L1–L4)
369.9
168.4
24.6
369.9
G3 (L9–L10)
75.2
27.1
1.3
75.2
G4 (L5–L6)
60.7
177.6
21.7
177.6
G5 (L1, L3, L5, L7)
224.1
177.6
24.6
224.1
G6 (L2, L4, L6, L8)
369.9
168.4
7.2
369.9
G7 (L1, L2, L5, L6)
139.5
177.6
24.6
177.6
G8 (L3, L4, L7, L8)
369.9
156.0
12.8
369.9
High-magnitude failure events with the erosion amount more than 500 cm 3 were analyzed
Fig. 10.7 Increment of the
mass failure as the rainfall
intensity was increased by
150%
–50%
0%
50%
100%
150%
Avalanche Landslide Mudslide
WGE
Increment of the mass failure
Sum
Peak
intensity and long period could give rise to avalanches with a relatively larger range
and bulk.
Figure 10.8 portrays increment of the mass failure as the rainfall duration
increased. If the rainfall intensity was kept constant at a low intensity, 0.8 mm/min,
while the duration increased from 30 to 60 min—namely, a 100% increase in rainfall
duration—the volume of avalanche was not relatively obviously enlarged, but total
volumes of the landslide and mudslide were augmented to 24.9 and 19.5 times, and
the maximum volumes of individual landslide and mudslide were augmented 5.5
and 15.6 times, respectively. In conclusion, the loess slope under light rain is more
easily subjected to landslide and mudflow as rainfall increases in duration.
In the experiments, a clear relationship has been found between the failure style
and the rainfall mode, i.e., intensity or duration. Nevertheless, the result is so different
from that in other geographic regions described by Lourenço et al. (2006), where no
clear relation was found between the pore water pressure and the failure mode.