

134
8 Sediment-Storage Effects of Check-Dam …
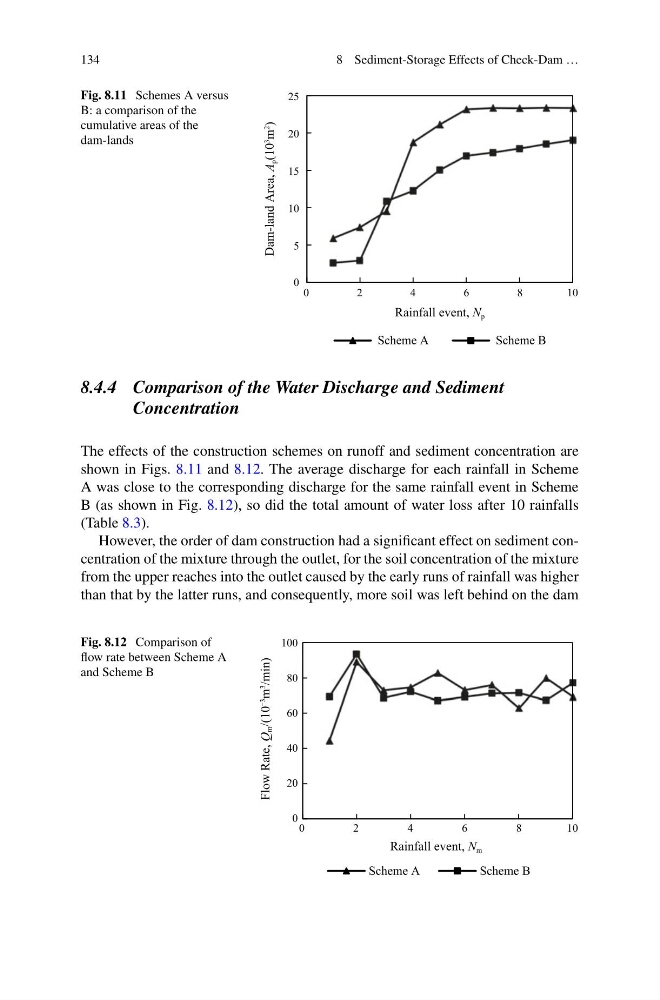
Fig. 8.11 Schemes A versus
B: a comparison of the
cumulative areas of the
dam-lands
0
5
10
15
20
25
0
2
4
6
8
1 0
Dam-land Area, A
p (10
3
m
2
)
Rainfall event, N p
Scheme A
Scheme B
8.4.4 Comparison of the Water Discharge and Sediment
Concentration
The effects of the construction schemes on runoff and sediment concentration are
shown in Figs. 8.11 and 8.12. The average discharge for each rainfall in Scheme
A was close to the corresponding discharge for the same rainfall event in Scheme
B (as shown in Fig. 8.12), so did the total amount of water loss after 10 rainfalls
(Table 8.3).
However, the order of dam construction had a significant effect on sediment concentration of the mixture through the outlet, for the soil concentration of the mixture
from the upper reaches into the outlet caused by the early runs of rainfall was higher
than that by the latter runs, and consequently, more soil was left behind on the dam
Fig. 8.12 Comparison of
flow rate between Scheme A
and Scheme B
0
20
40
60
80
100
0
2
4
6
8
1 0
Flow Rate, Q
m /(10
3
m
3
/min)
Rainfall event, N m
Scheme A
Scheme B
8 Sediment-Storage Effects of Check-Dam …
Fig. 8.11 Schemes A versus
B: a comparison of the
cumulative areas of the
dam-lands
0
5
10
15
20
25
0
2
4
6
8
1 0
Dam-land Area, A
p (10
3
m
2
)
Rainfall event, N p
Scheme A
Scheme B
8.4.4 Comparison of the Water Discharge and Sediment
Concentration
The effects of the construction schemes on runoff and sediment concentration are
shown in Figs. 8.11 and 8.12. The average discharge for each rainfall in Scheme
A was close to the corresponding discharge for the same rainfall event in Scheme
B (as shown in Fig. 8.12), so did the total amount of water loss after 10 rainfalls
(Table 8.3).
However, the order of dam construction had a significant effect on sediment concentration of the mixture through the outlet, for the soil concentration of the mixture
from the upper reaches into the outlet caused by the early runs of rainfall was higher
than that by the latter runs, and consequently, more soil was left behind on the dam
Fig. 8.12 Comparison of
flow rate between Scheme A
and Scheme B
0
20
40
60
80
100
0
2
4
6
8
1 0
Flow Rate, Q
m /(10
3
m
3
/min)
Rainfall event, N m
Scheme A
Scheme B