

8.4 Results and Discussion
135
land. Thus, the amount of retained soil was positively correlated with the earliness
of construction of the key dams.
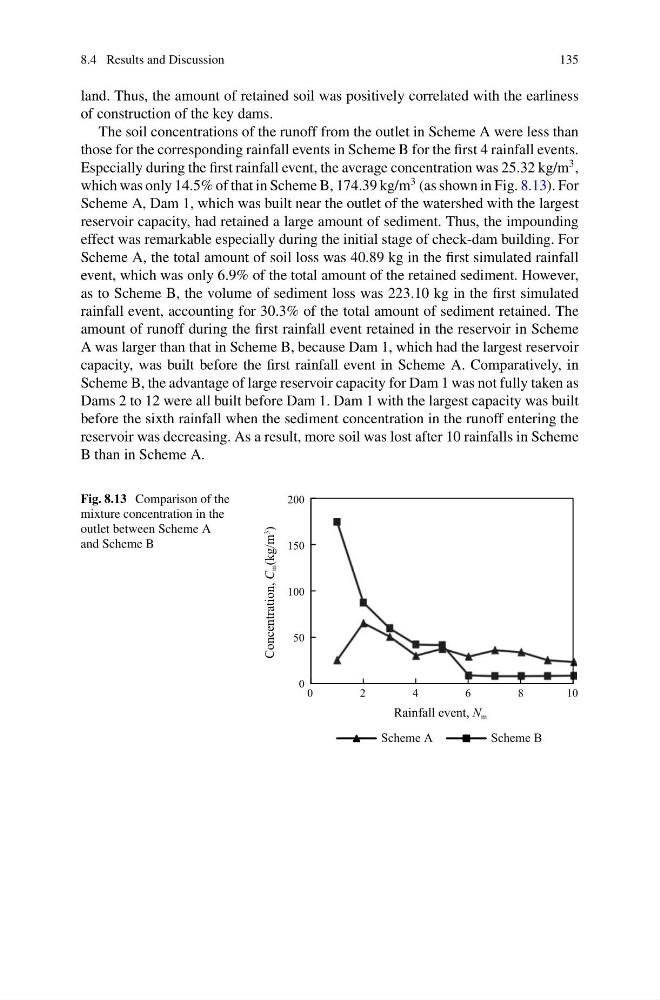
The soil concentrations of the runoff from the outlet in Scheme A were less than
those for the corresponding rainfall events in Scheme B for the first 4 rainfall events.
Especially during the first rainfall event, the average concentration was 25.32 kg/m
3 ,
which was only 14.5% of that in Scheme B, 174.39 kg/m
3 (as shown in Fig. 8.13). For
Scheme A, Dam 1, which was built near the outlet of the watershed with the largest
reservoir capacity, had retained a large amount of sediment. Thus, the impounding
effect was remarkable especially during the initial stage of check-dam building. For
Scheme A, the total amount of soil loss was 40.89 kg in the first simulated rainfall
event, which was only 6.9% of the total amount of the retained sediment. However,
as to Scheme B, the volume of sediment loss was 223.10 kg in the first simulated
rainfall event, accounting for 30.3% of the total amount of sediment retained. The
amount of runoff during the first rainfall event retained in the reservoir in Scheme
A was larger than that in Scheme B, because Dam 1, which had the largest reservoir
capacity, was built before the first rainfall event in Scheme A. Comparatively, in
Scheme B, the advantage of large reservoir capacity for Dam 1 was not fully taken as
Dams 2 to 12 were all built before Dam 1. Dam 1 with the largest capacity was built
before the sixth rainfall when the sediment concentration in the runoff entering the
reservoir was decreasing. As a result, more soil was lost after 10 rainfalls in Scheme
B than in Scheme A.
Fig. 8.13 Comparison of the
mixture concentration in the
outlet between Scheme A
and Scheme B
0
50
100
150
200
0
2
4
6
8
1 0
Concentration, C
m (kg/m
3
)
Rainfall event, N m
Scheme A
Scheme B
135
land. Thus, the amount of retained soil was positively correlated with the earliness
of construction of the key dams.
The soil concentrations of the runoff from the outlet in Scheme A were less than
those for the corresponding rainfall events in Scheme B for the first 4 rainfall events.
Especially during the first rainfall event, the average concentration was 25.32 kg/m
3 ,
which was only 14.5% of that in Scheme B, 174.39 kg/m
3 (as shown in Fig. 8.13). For
Scheme A, Dam 1, which was built near the outlet of the watershed with the largest
reservoir capacity, had retained a large amount of sediment. Thus, the impounding
effect was remarkable especially during the initial stage of check-dam building. For
Scheme A, the total amount of soil loss was 40.89 kg in the first simulated rainfall
event, which was only 6.9% of the total amount of the retained sediment. However,
as to Scheme B, the volume of sediment loss was 223.10 kg in the first simulated
rainfall event, accounting for 30.3% of the total amount of sediment retained. The
amount of runoff during the first rainfall event retained in the reservoir in Scheme
A was larger than that in Scheme B, because Dam 1, which had the largest reservoir
capacity, was built before the first rainfall event in Scheme A. Comparatively, in
Scheme B, the advantage of large reservoir capacity for Dam 1 was not fully taken as
Dams 2 to 12 were all built before Dam 1. Dam 1 with the largest capacity was built
before the sixth rainfall when the sediment concentration in the runoff entering the
reservoir was decreasing. As a result, more soil was lost after 10 rainfalls in Scheme
B than in Scheme A.
Fig. 8.13 Comparison of the
mixture concentration in the
outlet between Scheme A
and Scheme B
0
50
100
150
200
0
2
4
6
8
1 0
Concentration, C
m (kg/m
3
)
Rainfall event, N m
Scheme A
Scheme B