

8.4 Results and Discussion
133
Table 8.3 Soil and water loss in the rainfall simulation experiments
Rainfall event Scheme A
Scheme B
Dams built
before the
rainfall event
Sediment loss, S p
(10 6 kg)
Dams built
before the
rainfall event
Sediment loss, S p
(10 6 kg)
Individual Total
Individual Total
1
Dam 1
0.7
10.6
Dam 9, 10, 11
& 12
4.1
13.5
2
2.5
Dam 7
3.9
3
Dam 2
1.3
Dam 3, 4, 5 & 6 1.9
4
Dam 3, 4, 5 & 6 0.8
Dam 8
1.4
5
Dam 7
0.9
Dam 2
0.9
6
Dam 8, 9, 10,
11 & 12
0.9
Dam 1
0.3
7
0.7
0.3
8
0.9
0.3
9
1.1
0.3
10
0.7
0.2
Notes Dams 1, 2 and 8 are 18 m high, Dams 3, 4, 5, 6 and 7 are 9 m high, and Dams 9, 10, 11 and
12 are 5.4 m high, respectively
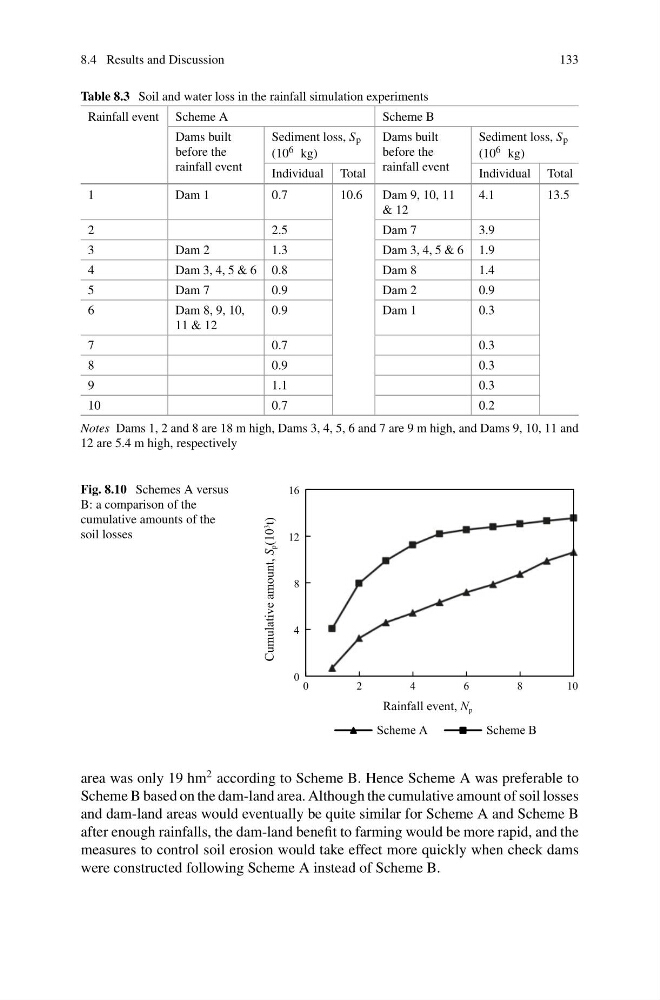
Fig. 8.10 Schemes A versus
B: a comparison of the
cumulative amounts of the
soil losses
0
4
8
12
16
0
2
4
6
8
1 0
Cumulative amount, S
p (10
3
t)
Rainfall event, N p
Scheme A
Scheme B
area was only 19 hm
2 according to Scheme B. Hence Scheme A was preferable to
Scheme B based on the dam-land area. Although the cumulative amount of soil losses
and dam-land areas would eventually be quite similar for Scheme A and Scheme B
after enough rainfalls, the dam-land benefit to farming would be more rapid, and the
measures to control soil erosion would take effect more quickly when check dams
were constructed following Scheme A instead of Scheme B.
133
Table 8.3 Soil and water loss in the rainfall simulation experiments
Rainfall event Scheme A
Scheme B
Dams built
before the
rainfall event
Sediment loss, S p
(10 6 kg)
Dams built
before the
rainfall event
Sediment loss, S p
(10 6 kg)
Individual Total
Individual Total
1
Dam 1
0.7
10.6
Dam 9, 10, 11
& 12
4.1
13.5
2
2.5
Dam 7
3.9
3
Dam 2
1.3
Dam 3, 4, 5 & 6 1.9
4
Dam 3, 4, 5 & 6 0.8
Dam 8
1.4
5
Dam 7
0.9
Dam 2
0.9
6
Dam 8, 9, 10,
11 & 12
0.9
Dam 1
0.3
7
0.7
0.3
8
0.9
0.3
9
1.1
0.3
10
0.7
0.2
Notes Dams 1, 2 and 8 are 18 m high, Dams 3, 4, 5, 6 and 7 are 9 m high, and Dams 9, 10, 11 and
12 are 5.4 m high, respectively
Fig. 8.10 Schemes A versus
B: a comparison of the
cumulative amounts of the
soil losses
0
4
8
12
16
0
2
4
6
8
1 0
Cumulative amount, S
p (10
3
t)
Rainfall event, N p
Scheme A
Scheme B
area was only 19 hm
2 according to Scheme B. Hence Scheme A was preferable to
Scheme B based on the dam-land area. Although the cumulative amount of soil losses
and dam-land areas would eventually be quite similar for Scheme A and Scheme B
after enough rainfalls, the dam-land benefit to farming would be more rapid, and the
measures to control soil erosion would take effect more quickly when check dams
were constructed following Scheme A instead of Scheme B.