

254
Table 8.7 Species-wise Below Ground Biomass (BGB) and Below Ground Carbon (BGC) per
unit area in Gulf of Mannar
Species
BGB (g dry wt. m
−2 )
BGC (g dry wt.
m
−2 )
Stn 1
Stn 2
Stn 3
Stn 1 Stn 2 Stn 3
Cymodocea serrulata
144.04
(48.4%)
140.29
(48.6%)
132.41
(49.1%)
69.72 68.18 65.01
Thalassia hemprichii
71.79
(47.9%)
63.23
(48.2%)
49.84 (48.5%) 34.39 30.48 24.17
Halophila ovalis
36.31
(39.69%)
33.14
(38.43%)
24.75
(38.11%)
14.41 12.74 9.43
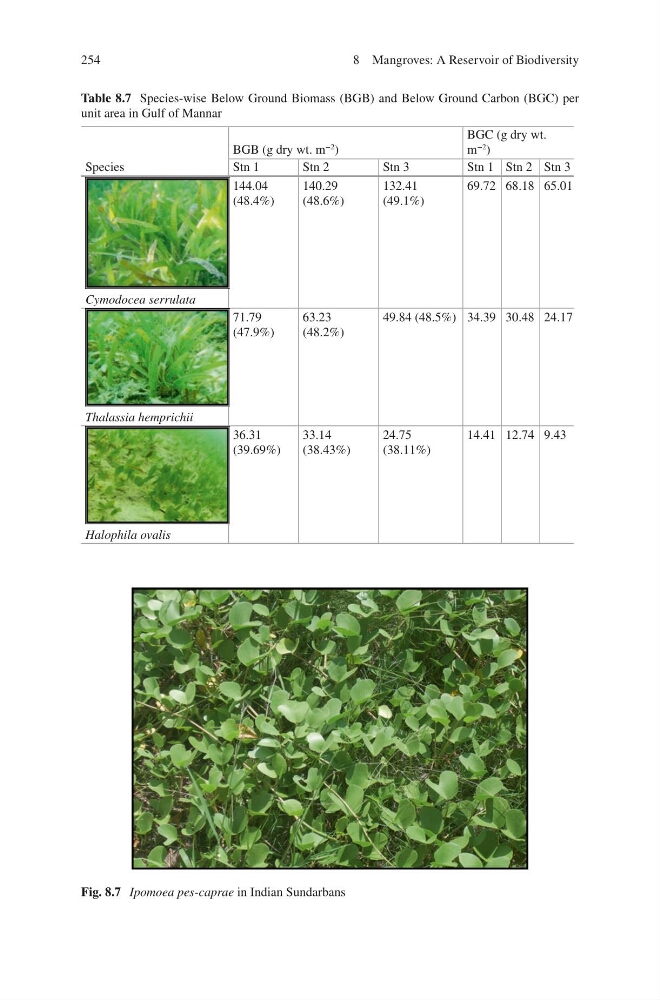
Fig. 8.7 Ipomoea pes-caprae in Indian Sundarbans
8 Mangroves: A Reservoir of Biodiversity
Table 8.7 Species-wise Below Ground Biomass (BGB) and Below Ground Carbon (BGC) per
unit area in Gulf of Mannar
Species
BGB (g dry wt. m
−2 )
BGC (g dry wt.
m
−2 )
Stn 1
Stn 2
Stn 3
Stn 1 Stn 2 Stn 3
Cymodocea serrulata
144.04
(48.4%)
140.29
(48.6%)
132.41
(49.1%)
69.72 68.18 65.01
Thalassia hemprichii
71.79
(47.9%)
63.23
(48.2%)
49.84 (48.5%) 34.39 30.48 24.17
Halophila ovalis
36.31
(39.69%)
33.14
(38.43%)
24.75
(38.11%)
14.41 12.74 9.43
Fig. 8.7 Ipomoea pes-caprae in Indian Sundarbans
8 Mangroves: A Reservoir of Biodiversity