

191
A total of 4011 species, including 920 plant (23%) and 3091 animal (77%) species
have been recorded from Indian mangrove ecosystems, which is highest in the
world (Bhatt and Kathiresan 2011).
In recognition of the developing financial incentives available for mangrove conservation based on carbon PES (Payment for Ecosystem Services) schemes, data
banks have been developed in certain regions like deltaic South Asia (Donato et al.
2011; Banerjee et al. 2013; Mitra 2013; Mitra and Zaman 2015), Insular SE Asia
(Donato et al. 2011), tropical Pacific islands (Donato et al. 2011, 2012; Kauffman
et al. 2011) and karst landscapes in the neotropics (Adame et al. 2013). However,
these landscapes differ with mainland SE Asia to varying degrees in terms of geomorphology, sediment input, mangrove species and community structure (Spalding
et al. 1997). Hence a generalized model will not fit for assessment of their growth,
survival, population density and carbon/nitrogen storage potential.
Biomass estimation is the first step to assess the carbon and nitrogen storage
potential of producer community. There are many possible approaches to assess
mangrove forest biomass. The most accurate method is to uproot all the trees to
obtain their dry mass. However, this is impractical both due to the cost and effort
required and the fact that it would negate the goal of conserving mangrove stands
(Ketterings et al. 2001). A more reasonable approach is to cut down a few trees and
develop a mathematical model relating biomass to easily measured tree variables,
such as diameter at breast height (DBH) and wood density (i.e., allometric equations) (Komiyama et al. 2005). The variables can then be measured in a forest to
develop biomass estimates. This approach is only practical at the plot scale and
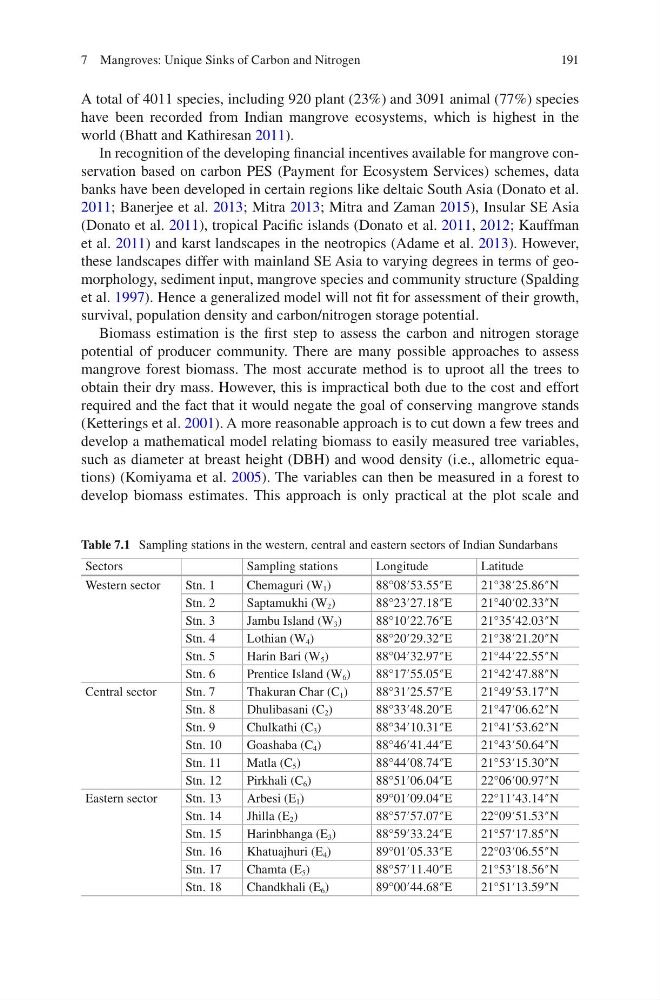
Table 7.1 Sampling stations in the western, central and eastern sectors of Indian Sundarbans
Sectors
Sampling stations
Longitude
Latitude
Western sector
Stn. 1
Chemaguri (W 1 )
88°08′53.55″E
21°38′25.86″N
Stn. 2
Saptamukhi (W 2 )
88°23′27.18″E
21°40′02.33″N
Stn. 3
Jambu Island (W 3 )
88°10′22.76″E
21°35′42.03″N
Stn. 4
Lothian (W 4 )
88°20′29.32″E
21°38′21.20″N
Stn. 5
Harin Bari (W 5 )
88°04′32.97″E
21°44′22.55″N
Stn. 6
Prentice Island (W 6 )
88°17′55.05″E
21°42′47.88″N
Central sector
Stn. 7
Thakuran Char (C 1 )
88°31′25.57″E
21°49′53.17″N
Stn. 8
Dhulibasani (C 2 )
88°33′48.20″E
21°47′06.62″N
Stn. 9
Chulkathi (C 3 )
88°34′10.31″E
21°41′53.62″N
Stn. 10
Goashaba (C 4 )
88°46′41.44″E
21°43′50.64″N
Stn. 11
Matla (C 5 )
88°44′08.74″E
21°53′15.30″N
Stn. 12
Pirkhali (C 6 )
88°51′06.04″E
22°06′00.97″N
Eastern sector
Stn. 13
Arbesi (E 1 )
89°01′09.04″E
22°11′43.14″N
Stn. 14
Jhilla (E 2 )
88°57′57.07″E
22°09′51.53″N
Stn. 15
Harinbhanga (E 3 )
88°59′33.24″E
21°57′17.85″N
Stn. 16
Khatuajhuri (E 4 )
89°01′05.33″E
22°03′06.55″N
Stn. 17
Chamta (E 5 )
88°57′11.40″E
21°53′18.56″N
Stn. 18
Chandkhali (E 6 )
89°00′44.68″E
21°51′13.59″N
7 Mangroves: Unique Sinks of Carbon and Nitrogen
A total of 4011 species, including 920 plant (23%) and 3091 animal (77%) species
have been recorded from Indian mangrove ecosystems, which is highest in the
world (Bhatt and Kathiresan 2011).
In recognition of the developing financial incentives available for mangrove conservation based on carbon PES (Payment for Ecosystem Services) schemes, data
banks have been developed in certain regions like deltaic South Asia (Donato et al.
2011; Banerjee et al. 2013; Mitra 2013; Mitra and Zaman 2015), Insular SE Asia
(Donato et al. 2011), tropical Pacific islands (Donato et al. 2011, 2012; Kauffman
et al. 2011) and karst landscapes in the neotropics (Adame et al. 2013). However,
these landscapes differ with mainland SE Asia to varying degrees in terms of geomorphology, sediment input, mangrove species and community structure (Spalding
et al. 1997). Hence a generalized model will not fit for assessment of their growth,
survival, population density and carbon/nitrogen storage potential.
Biomass estimation is the first step to assess the carbon and nitrogen storage
potential of producer community. There are many possible approaches to assess
mangrove forest biomass. The most accurate method is to uproot all the trees to
obtain their dry mass. However, this is impractical both due to the cost and effort
required and the fact that it would negate the goal of conserving mangrove stands
(Ketterings et al. 2001). A more reasonable approach is to cut down a few trees and
develop a mathematical model relating biomass to easily measured tree variables,
such as diameter at breast height (DBH) and wood density (i.e., allometric equations) (Komiyama et al. 2005). The variables can then be measured in a forest to
develop biomass estimates. This approach is only practical at the plot scale and
Table 7.1 Sampling stations in the western, central and eastern sectors of Indian Sundarbans
Sectors
Sampling stations
Longitude
Latitude
Western sector
Stn. 1
Chemaguri (W 1 )
88°08′53.55″E
21°38′25.86″N
Stn. 2
Saptamukhi (W 2 )
88°23′27.18″E
21°40′02.33″N
Stn. 3
Jambu Island (W 3 )
88°10′22.76″E
21°35′42.03″N
Stn. 4
Lothian (W 4 )
88°20′29.32″E
21°38′21.20″N
Stn. 5
Harin Bari (W 5 )
88°04′32.97″E
21°44′22.55″N
Stn. 6
Prentice Island (W 6 )
88°17′55.05″E
21°42′47.88″N
Central sector
Stn. 7
Thakuran Char (C 1 )
88°31′25.57″E
21°49′53.17″N
Stn. 8
Dhulibasani (C 2 )
88°33′48.20″E
21°47′06.62″N
Stn. 9
Chulkathi (C 3 )
88°34′10.31″E
21°41′53.62″N
Stn. 10
Goashaba (C 4 )
88°46′41.44″E
21°43′50.64″N
Stn. 11
Matla (C 5 )
88°44′08.74″E
21°53′15.30″N
Stn. 12
Pirkhali (C 6 )
88°51′06.04″E
22°06′00.97″N
Eastern sector
Stn. 13
Arbesi (E 1 )
89°01′09.04″E
22°11′43.14″N
Stn. 14
Jhilla (E 2 )
88°57′57.07″E
22°09′51.53″N
Stn. 15
Harinbhanga (E 3 )
88°59′33.24″E
21°57′17.85″N
Stn. 16
Khatuajhuri (E 4 )
89°01′05.33″E
22°03′06.55″N
Stn. 17
Chamta (E 5 )
88°57′11.40″E
21°53′18.56″N
Stn. 18
Chandkhali (E 6 )
89°00′44.68″E
21°51′13.59″N
7 Mangroves: Unique Sinks of Carbon and Nitrogen