

192
great effort is needed to measure all the trees in just 1 ha of mangrove forest. Models
based on remotely sensed data are presently the only feasible means of quantifying
mangrove forest biomass for forests of areas greater than a few hectares. Such
models utilize ground-based data and allometric equations to develop biomass estimates from which magnitude of carbon reservoir of the mangrove forests can be
assessed.
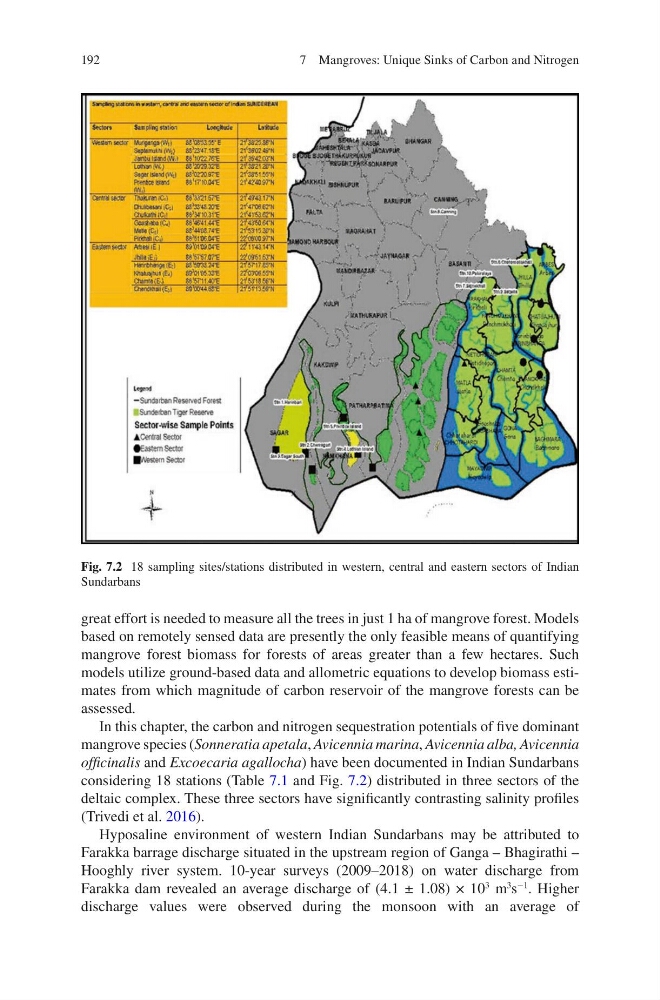
In this chapter, the carbon and nitrogen sequestration potentials of five dominant
mangrove species (Sonneratia apetala, Avicennia marina, Avicennia alba, Avicennia
officinalis and Excoecaria agallocha) have been documented in Indian Sundarbans
considering 18 stations (Table 7.1 and Fig. 7.2) distributed in three sectors of the
deltaic complex. These three sectors have significantly contrasting salinity profiles
(Trivedi et al. 2016).
Hyposaline environment of western Indian Sundarbans may be attributed to
Farakka barrage discharge situated in the upstream region of Ganga – Bhagirathi –
Hooghly river system. 10-year surveys (2009–2018) on water discharge from
Farakka dam revealed an average discharge of (4.1 ± 1.08) × 10
3
m
3
s
−1
. Higher
discharge values were observed during the monsoon with an average of
Fig. 7.2 18 sampling sites/stations distributed in western, central and eastern sectors of Indian
Sundarbans
7 Mangroves: Unique Sinks of Carbon and Nitrogen
great effort is needed to measure all the trees in just 1 ha of mangrove forest. Models
based on remotely sensed data are presently the only feasible means of quantifying
mangrove forest biomass for forests of areas greater than a few hectares. Such
models utilize ground-based data and allometric equations to develop biomass estimates from which magnitude of carbon reservoir of the mangrove forests can be
assessed.
In this chapter, the carbon and nitrogen sequestration potentials of five dominant
mangrove species (Sonneratia apetala, Avicennia marina, Avicennia alba, Avicennia
officinalis and Excoecaria agallocha) have been documented in Indian Sundarbans
considering 18 stations (Table 7.1 and Fig. 7.2) distributed in three sectors of the
deltaic complex. These three sectors have significantly contrasting salinity profiles
(Trivedi et al. 2016).
Hyposaline environment of western Indian Sundarbans may be attributed to
Farakka barrage discharge situated in the upstream region of Ganga – Bhagirathi –
Hooghly river system. 10-year surveys (2009–2018) on water discharge from
Farakka dam revealed an average discharge of (4.1 ± 1.08) × 10
3
m
3
s
−1
. Higher
discharge values were observed during the monsoon with an average of
Fig. 7.2 18 sampling sites/stations distributed in western, central and eastern sectors of Indian
Sundarbans
7 Mangroves: Unique Sinks of Carbon and Nitrogen