

123
simultaneously to monitor the selected heavy metals (biologically available form) in
the surface sediment.
During premonsoon of 2013, biologically available sediment Zn values ranged
from 24.21 ± 4.12 ppm dry wt. (at Bagmara) to 116.34 ± 4.09 ppm dry wt. (at
Frasergunj); during monsoon ranged from 17.44 ± 3.10 ppm dry wt. (at Bagmara)
to 89.24 ± 4.22 ppm dry wt. (at Harinbari) whereas, during postmonsoon it ranged
from 20.86 ± 3.76 ppm dry wt. (at Bagmara) to 84.88 ± 4.39 ppm dry wt. (at
Frasergunj). During premonsoon in the same year, biologically available Cu values
ranged from 7.05 ± 1.29 ppm dry wt. (at Bagmara) to 37.14 ± 3.23 ppm dry wt. (at
Kakdwip); during monsoon it ranged from 4.02 ± 1.08 ppm dry wt. (at Bagmara) to
25.78 ± 3.29 ppm dry wt. (at Frasergunj) whereas, it ranged from 5.99 ± 1.02 ppm
dry wt. (at Bagmara) to 30.66 ± 2.93 ppm dry wt. (at Frasergunj) during postmonsoon. Biologically available Pb values were found to range from 1.19 ± 0.09 ppm
dry wt. (at Bagmara) to 9.78 ± 1.98 ppm dry wt. (at Kakdwip) in premonsoon; in
monsoon it ranged from 0.65 ± 0.04 ppm dry wt. (at Bagmara) to 7.38 ± 1.02 ppm
dry wt. (at Kakdwip) and in postmonsoon it ranged from 0.76 ± 0.03 ppm dry wt.
(at Bagmara) to 7.43 ± 1.29 ppm dry wt. (at Kakdwip). Biologically available Hg
values were found to range from 0.27 ± 0.09 ppm dry wt. (at Bagmara) to
1.99 ± 0.12 ppm dry wt. (at Kakdwip) in premonsoon; in monsoon it ranged from
0.17 ± 0.01 ppm dry wt. (at Bagmara) to 1.01 ± 0.54 ppm dry wt. (at Kakdwip) and
in postmonsoon it ranged from 0.22 ± 0.02 ppm dry wt. (at Bagmara) to
1.32 ± 0.19 ppm dry wt. (at Kakdwip).
During premonsoon of 2014, biologically available sediment Zn values ranged
from 25.19 ± 3.90 ppm dry wt. (at Bagmara) to 117.32 ± 4.32 ppm dry wt. (at
Frasergunj;, during monsoon it ranged from 18.42 ± 3.06 ppm dry wt. (at Bagmara)
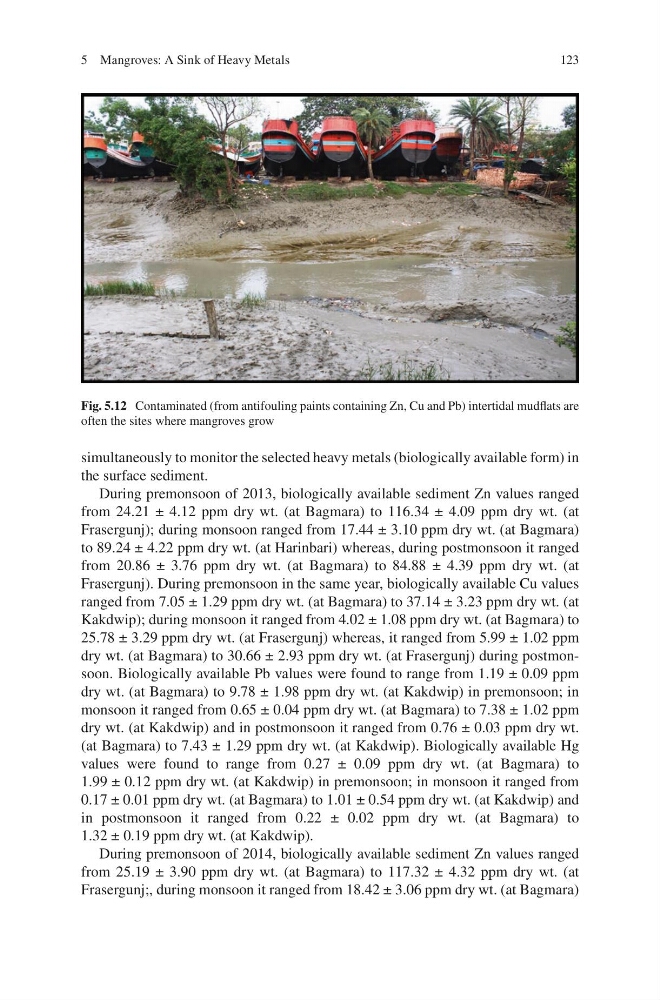
Fig. 5.12 Contaminated (from antifouling paints containing Zn, Cu and Pb) intertidal mudflats are
often the sites where mangroves grow
5 Mangroves: A Sink of Heavy Metals
simultaneously to monitor the selected heavy metals (biologically available form) in
the surface sediment.
During premonsoon of 2013, biologically available sediment Zn values ranged
from 24.21 ± 4.12 ppm dry wt. (at Bagmara) to 116.34 ± 4.09 ppm dry wt. (at
Frasergunj); during monsoon ranged from 17.44 ± 3.10 ppm dry wt. (at Bagmara)
to 89.24 ± 4.22 ppm dry wt. (at Harinbari) whereas, during postmonsoon it ranged
from 20.86 ± 3.76 ppm dry wt. (at Bagmara) to 84.88 ± 4.39 ppm dry wt. (at
Frasergunj). During premonsoon in the same year, biologically available Cu values
ranged from 7.05 ± 1.29 ppm dry wt. (at Bagmara) to 37.14 ± 3.23 ppm dry wt. (at
Kakdwip); during monsoon it ranged from 4.02 ± 1.08 ppm dry wt. (at Bagmara) to
25.78 ± 3.29 ppm dry wt. (at Frasergunj) whereas, it ranged from 5.99 ± 1.02 ppm
dry wt. (at Bagmara) to 30.66 ± 2.93 ppm dry wt. (at Frasergunj) during postmonsoon. Biologically available Pb values were found to range from 1.19 ± 0.09 ppm
dry wt. (at Bagmara) to 9.78 ± 1.98 ppm dry wt. (at Kakdwip) in premonsoon; in
monsoon it ranged from 0.65 ± 0.04 ppm dry wt. (at Bagmara) to 7.38 ± 1.02 ppm
dry wt. (at Kakdwip) and in postmonsoon it ranged from 0.76 ± 0.03 ppm dry wt.
(at Bagmara) to 7.43 ± 1.29 ppm dry wt. (at Kakdwip). Biologically available Hg
values were found to range from 0.27 ± 0.09 ppm dry wt. (at Bagmara) to
1.99 ± 0.12 ppm dry wt. (at Kakdwip) in premonsoon; in monsoon it ranged from
0.17 ± 0.01 ppm dry wt. (at Bagmara) to 1.01 ± 0.54 ppm dry wt. (at Kakdwip) and
in postmonsoon it ranged from 0.22 ± 0.02 ppm dry wt. (at Bagmara) to
1.32 ± 0.19 ppm dry wt. (at Kakdwip).
During premonsoon of 2014, biologically available sediment Zn values ranged
from 25.19 ± 3.90 ppm dry wt. (at Bagmara) to 117.32 ± 4.32 ppm dry wt. (at
Frasergunj;, during monsoon it ranged from 18.42 ± 3.06 ppm dry wt. (at Bagmara)
Fig. 5.12 Contaminated (from antifouling paints containing Zn, Cu and Pb) intertidal mudflats are
often the sites where mangroves grow
5 Mangroves: A Sink of Heavy Metals