

124
to 74.47 ± 3.92 ppm dry wt. (at Frasergunj) whereas, during postmonsoon it ranged
from 21.84 ± 4.21 ppm dry wt. (at Bagmara) to 85.86 ± 3.32 ppm dry wt. (at
Frasergunj). During premonsoon in the same year, biologically available Cu values
ranged from 8.03 ± 1.01 ppm dry wt. (at Bagmara) to 38.12 ± 3.20 ppm dry wt. (at
Kakdwip); during monsoon it ranged from 5.09 ± 1.43 ppm dry wt. (at Bagmara) to
26.76 ± 3.12 ppm dry wt. (at Frasergunj) whereas, it ranged from 6.97 ± 1.02 ppm
dry wt. (at Bagmara) to 31.64 ± 2.83 ppm dry wt. (at Frasergunj) at postmosoon.
Biologically available Pb values were found to range from 1.19 ± 0.08 ppm dry wt.
(at Bagmara) to 10.82 ± 1.04 ppm dry wt. (at Frasergunj) in premonsoon; in monsoon it ranged from 0.65 ± 0.01 ppm dry wt. (at Bagmara) to 8.36 ± 1.29 ppm dry
wt. (at Kakdwip) and in postmonsoon it ranged from 0.76 ± 0.06 ppm dry wt. (at
Bagmara) to 8.41 ± 1.11 ppm dry wt. (at Kakdwip) in 2014. Biologically available
Hg values were found to range from 0.34 ± 0.008 ppm dry wt. (at Bagmara) to
2.08 ± 0.17 ppm dry wt. (at Kakdwip) in premonsoon; in monsoon it ranged from
0.22 ± 0.003 ppm dry wt. (at Bagmara) to 1.01 ± 0.54 ppm dry wt. (at Kakdwip) and
in postmonsoon it ranged from 0.24 ± 0.006 ppm dry wt. (at Bagmara) to
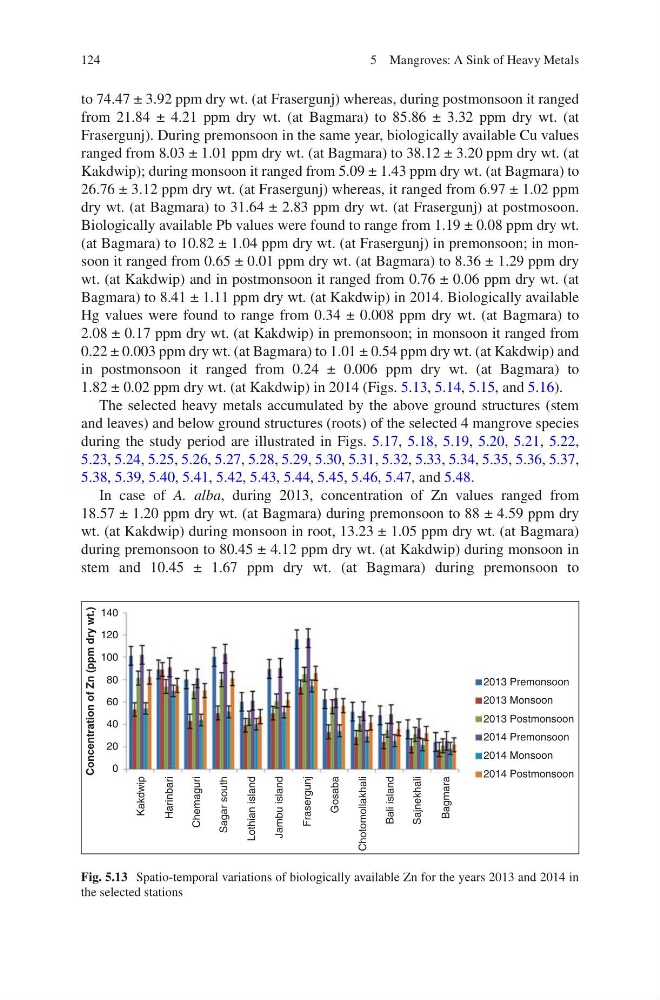
1.82 ± 0.02 ppm dry wt. (at Kakdwip) in 2014 (Figs. 5.13, 5.14, 5.15, and 5.16).
The selected heavy metals accumulated by the above ground structures (stem
and leaves) and below ground structures (roots) of the selected 4 mangrove species
during the study period are illustrated in Figs. 5.17, 5.18, 5.19, 5.20, 5.21, 5.22,
5.23, 5.24, 5.25, 5.26, 5.27, 5.28, 5.29, 5.30, 5.31, 5.32, 5.33, 5.34, 5.35, 5.36, 5.37,
5.38, 5.39, 5.40, 5.41, 5.42, 5.43, 5.44, 5.45, 5.46, 5.47, and 5.48.
In case of A. alba, during 2013, concentration of Zn values ranged from
18.57 ± 1.20 ppm dry wt. (at Bagmara) during premonsoon to 88 ± 4.59 ppm dry
wt. (at Kakdwip) during monsoon in root, 13.23 ± 1.05 ppm dry wt. (at Bagmara)
during premonsoon to 80.45 ± 4.12 ppm dry wt. (at Kakdwip) during monsoon in
stem and 10.45 ± 1.67 ppm dry wt. (at Bagmara) during premonsoon to
Kakdwip
Harinbari
Chemaguri
Sagar south
Lothian island
Jambu island
Frasergunj
Gosaba
Chotomollakhali
Bali island
Sajnekhali
Bagmara
2013 Premonsoon
2013 Postmonsoon
2013 Monsoon
2014 Premonsoon
2014 Postmonsoon
2014 Monsoon
Concentration of Zn (ppm dry wt.)
140
120
100
80
60
40
20
0
Fig. 5.13 Spatio-temporal variations of biologically available Zn for the years 2013 and 2014 in
the selected stations
5 Mangroves: A Sink of Heavy Metals
to 74.47 ± 3.92 ppm dry wt. (at Frasergunj) whereas, during postmonsoon it ranged
from 21.84 ± 4.21 ppm dry wt. (at Bagmara) to 85.86 ± 3.32 ppm dry wt. (at
Frasergunj). During premonsoon in the same year, biologically available Cu values
ranged from 8.03 ± 1.01 ppm dry wt. (at Bagmara) to 38.12 ± 3.20 ppm dry wt. (at
Kakdwip); during monsoon it ranged from 5.09 ± 1.43 ppm dry wt. (at Bagmara) to
26.76 ± 3.12 ppm dry wt. (at Frasergunj) whereas, it ranged from 6.97 ± 1.02 ppm
dry wt. (at Bagmara) to 31.64 ± 2.83 ppm dry wt. (at Frasergunj) at postmosoon.
Biologically available Pb values were found to range from 1.19 ± 0.08 ppm dry wt.
(at Bagmara) to 10.82 ± 1.04 ppm dry wt. (at Frasergunj) in premonsoon; in monsoon it ranged from 0.65 ± 0.01 ppm dry wt. (at Bagmara) to 8.36 ± 1.29 ppm dry
wt. (at Kakdwip) and in postmonsoon it ranged from 0.76 ± 0.06 ppm dry wt. (at
Bagmara) to 8.41 ± 1.11 ppm dry wt. (at Kakdwip) in 2014. Biologically available
Hg values were found to range from 0.34 ± 0.008 ppm dry wt. (at Bagmara) to
2.08 ± 0.17 ppm dry wt. (at Kakdwip) in premonsoon; in monsoon it ranged from
0.22 ± 0.003 ppm dry wt. (at Bagmara) to 1.01 ± 0.54 ppm dry wt. (at Kakdwip) and
in postmonsoon it ranged from 0.24 ± 0.006 ppm dry wt. (at Bagmara) to
1.82 ± 0.02 ppm dry wt. (at Kakdwip) in 2014 (Figs. 5.13, 5.14, 5.15, and 5.16).
The selected heavy metals accumulated by the above ground structures (stem
and leaves) and below ground structures (roots) of the selected 4 mangrove species
during the study period are illustrated in Figs. 5.17, 5.18, 5.19, 5.20, 5.21, 5.22,
5.23, 5.24, 5.25, 5.26, 5.27, 5.28, 5.29, 5.30, 5.31, 5.32, 5.33, 5.34, 5.35, 5.36, 5.37,
5.38, 5.39, 5.40, 5.41, 5.42, 5.43, 5.44, 5.45, 5.46, 5.47, and 5.48.
In case of A. alba, during 2013, concentration of Zn values ranged from
18.57 ± 1.20 ppm dry wt. (at Bagmara) during premonsoon to 88 ± 4.59 ppm dry
wt. (at Kakdwip) during monsoon in root, 13.23 ± 1.05 ppm dry wt. (at Bagmara)
during premonsoon to 80.45 ± 4.12 ppm dry wt. (at Kakdwip) during monsoon in
stem and 10.45 ± 1.67 ppm dry wt. (at Bagmara) during premonsoon to
Kakdwip
Harinbari
Chemaguri
Sagar south
Lothian island
Jambu island
Frasergunj
Gosaba
Chotomollakhali
Bali island
Sajnekhali
Bagmara
2013 Premonsoon
2013 Postmonsoon
2013 Monsoon
2014 Premonsoon
2014 Postmonsoon
2014 Monsoon
Concentration of Zn (ppm dry wt.)
140
120
100
80
60
40
20
0
Fig. 5.13 Spatio-temporal variations of biologically available Zn for the years 2013 and 2014 in
the selected stations
5 Mangroves: A Sink of Heavy Metals