

Vol.:(0123456789)
SN Applied Sciences
(2023) 5:158
| https://doi.org/10.1007/s42452-023-05376-x
Research Article
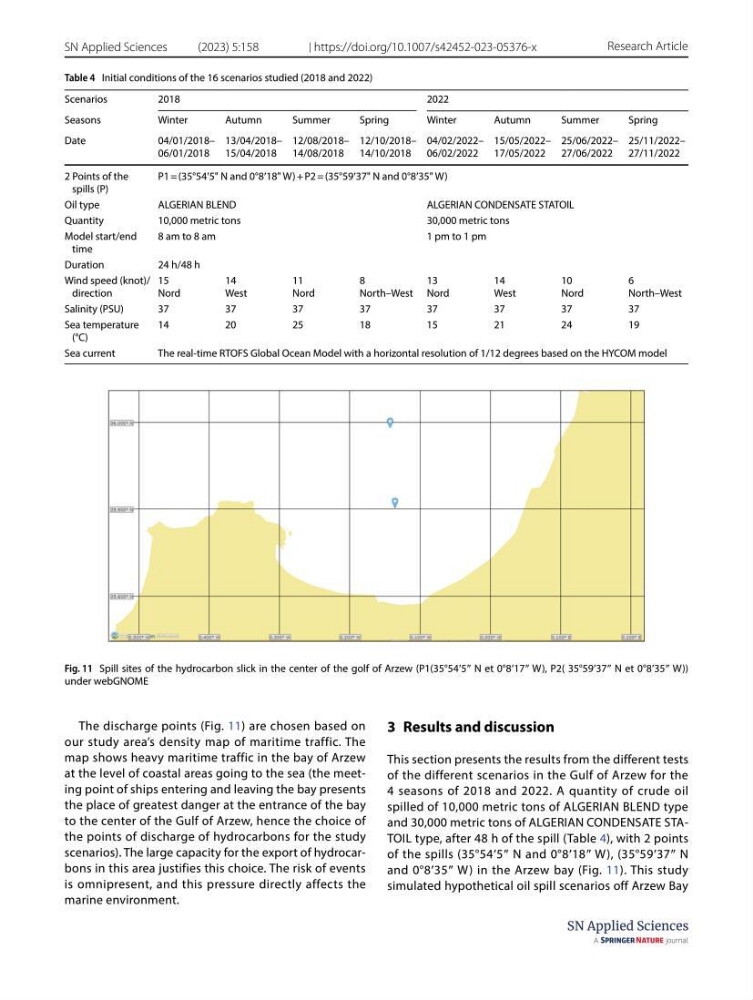
The discharge points (Fig. 11) are chosen based on
our study area’s density map of maritime traffic. The
map shows heavy maritime traffic in the bay of Arzew
at the level of coastal areas going to the sea (the meeting point of ships entering and leaving the bay presents
the place of greatest danger at the entrance of the bay
to the center of the Gulf of Arzew, hence the choice of
the points of discharge of hydrocarbons for the study
scenarios). The large capacity for the export of hydrocarbons in this area justifies this choice. The risk of events
is omnipresent, and this pressure directly affects the
marine environment.
3 Results and discussion
This section presents the results from the different tests
of the different scenarios in the Gulf of Arzew for the
4 seasons of 2018 and 2022. A quantity of crude oil
spilled of 10,000 metric tons of ALGERIAN BLEND type
and 30,000 metric tons of ALGERIAN CONDENSATE STATOIL type, after 48 h of the spill (Table 4), with 2 points
of the spills (35°54′5″ N and 0°8′18″ W), (35°59′37″ N
and 0°8′35″ W) in the Arzew bay (Fig. 11). This study
simulated hypothetical oil spill scenarios off Arzew Bay
Table 4 Initial conditions of the 16 scenarios studied (2018 and 2022)
Scenarios
2018
2022
Seasons
Winter
Autumn
Summer
Spring
Winter
Autumn
Summer
Spring
Date
04/01/2018–
06/01/2018
13/04/2018–
15/04/2018
12/08/2018–
14/08/2018
12/10/2018–
14/10/2018
04/02/2022–
06/02/2022
15/05/2022–
17/05/2022
25/06/2022–
27/06/2022
25/11/2022–
27/11/2022
2 Points of the
spills (P)
P1 = (35°54′5" N and 0°8′18" W) + P2 = (35°59′37" N and 0°8′35" W)
Oil type
ALGERIAN BLEND
ALGERIAN CONDENSATE STATOIL
Quantity
10,000 metric tons
30,000 metric tons
Model start/end
time
8 am to 8 am
1 pm to 1 pm
Duration
24 h/48 h
Wind speed (knot)/
direction
15
Nord
14
West
11
Nord
8
North–West
13
Nord
14
West
10
Nord
6
North–West
Salinity (PSU)
37
37
37
37
37
37
37
37
Sea temperature
(°C)
14
20
25
18
15
21
24
19
Sea current
The real-time RTOFS Global Ocean Model with a horizontal resolution of 1/12 degrees based on the HYCOM model
Fig. 11 Spill sites of the hydrocarbon slick in the center of the golf of Arzew (P1(35°54′5″ N et 0°8′17″ W), P2( 35°59′37″ N et 0°8′35″ W))
under webGNOME
SN Applied Sciences
(2023) 5:158
| https://doi.org/10.1007/s42452-023-05376-x
Research Article
The discharge points (Fig. 11) are chosen based on
our study area’s density map of maritime traffic. The
map shows heavy maritime traffic in the bay of Arzew
at the level of coastal areas going to the sea (the meeting point of ships entering and leaving the bay presents
the place of greatest danger at the entrance of the bay
to the center of the Gulf of Arzew, hence the choice of
the points of discharge of hydrocarbons for the study
scenarios). The large capacity for the export of hydrocarbons in this area justifies this choice. The risk of events
is omnipresent, and this pressure directly affects the
marine environment.
3 Results and discussion
This section presents the results from the different tests
of the different scenarios in the Gulf of Arzew for the
4 seasons of 2018 and 2022. A quantity of crude oil
spilled of 10,000 metric tons of ALGERIAN BLEND type
and 30,000 metric tons of ALGERIAN CONDENSATE STATOIL type, after 48 h of the spill (Table 4), with 2 points
of the spills (35°54′5″ N and 0°8′18″ W), (35°59′37″ N
and 0°8′35″ W) in the Arzew bay (Fig. 11). This study
simulated hypothetical oil spill scenarios off Arzew Bay
Table 4 Initial conditions of the 16 scenarios studied (2018 and 2022)
Scenarios
2018
2022
Seasons
Winter
Autumn
Summer
Spring
Winter
Autumn
Summer
Spring
Date
04/01/2018–
06/01/2018
13/04/2018–
15/04/2018
12/08/2018–
14/08/2018
12/10/2018–
14/10/2018
04/02/2022–
06/02/2022
15/05/2022–
17/05/2022
25/06/2022–
27/06/2022
25/11/2022–
27/11/2022
2 Points of the
spills (P)
P1 = (35°54′5" N and 0°8′18" W) + P2 = (35°59′37" N and 0°8′35" W)
Oil type
ALGERIAN BLEND
ALGERIAN CONDENSATE STATOIL
Quantity
10,000 metric tons
30,000 metric tons
Model start/end
time
8 am to 8 am
1 pm to 1 pm
Duration
24 h/48 h
Wind speed (knot)/
direction
15
Nord
14
West
11
Nord
8
North–West
13
Nord
14
West
10
Nord
6
North–West
Salinity (PSU)
37
37
37
37
37
37
37
37
Sea temperature
(°C)
14
20
25
18
15
21
24
19
Sea current
The real-time RTOFS Global Ocean Model with a horizontal resolution of 1/12 degrees based on the HYCOM model
Fig. 11 Spill sites of the hydrocarbon slick in the center of the golf of Arzew (P1(35°54′5″ N et 0°8′17″ W), P2( 35°59′37″ N et 0°8′35″ W))
under webGNOME