

Vol.:(0123456789)
SN Applied Sciences
(2023) 5:158
| https://doi.org/10.1007/s42452-023-05376-x
Research Article
coming from the station of Arzew. Calm and moderate
winds characterize this station in the autumn and spring
seasons. The dominant wind directions are North and
Southwest, appearing annually. About 48.6% of the
winds are between 1 and 5 m/s, 31.6% between 6 and
10 m/s, and 2.5% between 11 and 15 m/s. The most frequent speeds are those between 1 and 5 m/s (Fig. 7)
[61].
The data show that in January, calm winds of speed
1 < F(m/s) < 5 are from the Southwest (SW) direction, as
well as winds of speed 6 < F(m/s) < 10 from the westsouthwest (WSW) direction. For April, the wind force
between 6 (m/s) and 10 (m/s) is in the West direction
and is the most predominant. It is in the North direction for 01 < F(m/s) < 05. In July, the wind direction is
North, with a very high scale for 01 < F(m/s) < 05 and
06 < F(m/s) < 10. The winds in October represent a variation between two directions North and South West
(SW) [36].
2.3.2 Surface sea currents
At the level of the Gulf of Arzew, the currents are oriented
mainly toward the East. These currents flow 20–30 cm/s
off Mostaganem, 40 km from the coast, and at 50 m depth.
At the level of Arzew, a branch of this current enters the
Gulf. Under the effect of the Coriolis force, currents appear
clockwise, and their speed is very low (8 to 10 cm/s) [16].
Reliable oceanographic data are integral to oil spill vulnerability mapping and form the basis for accurate forecasting. Table 3 presents the different data sources integrated
with webGNOME software. We studied local climatology
and drew some idealized cases. For the different simulations, we created the actual data file using the dialog
boxes, variable wind, spill information, temperature and
salinity of the sea surface. These accurate data were
obtained from the meteorological station of Arzew and
the outputs at sea (in situ data).
The wind speed, direction, and values are integrated
manually using dialog boxes under the webGNOME software. The current sea data is integrated from the real-time
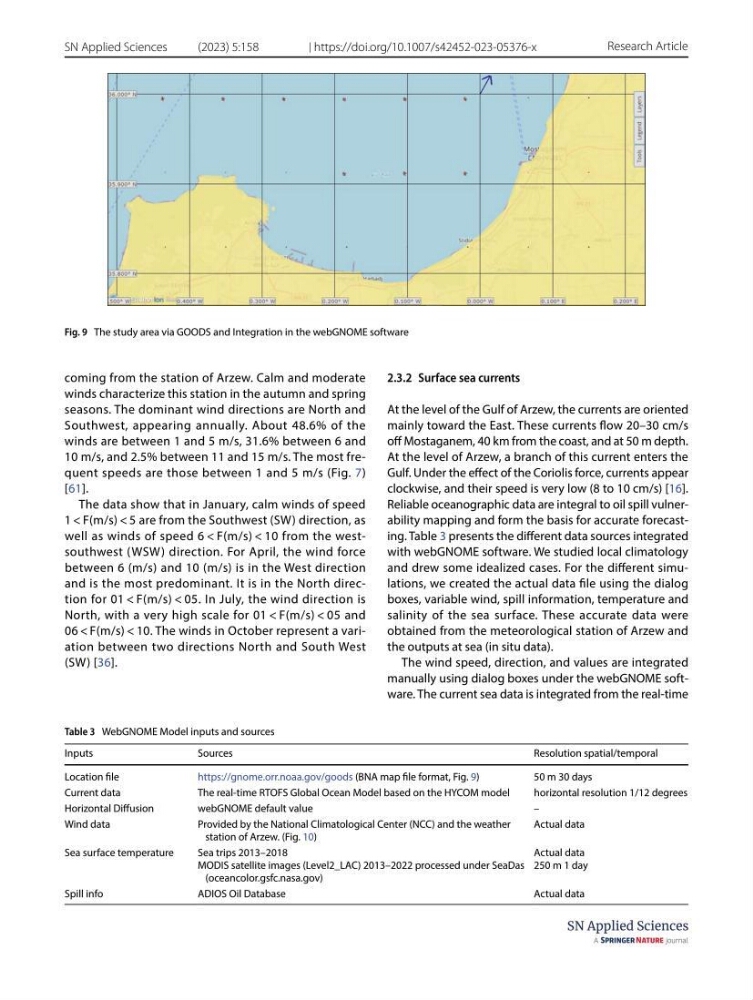
Fig. 9 The study area via GOODS and Integration in the webGNOME software
Table 3 WebGNOME Model inputs and sources
Inputs
Sources
Resolution spatial/temporal
Location file
https:// gnome. orr. noaa. gov/ goods (BNA map file format, Fig. 9)
50 m 30 days
Current data
The real-time RTOFS Global Ocean Model based on the HYCOM model
horizontal resolution 1/12 degrees
Horizontal Diffusion
webGNOME default value
–
Wind data
Provided by the National Climatological Center (NCC) and the weather
station of Arzew. (Fig. 10)
Actual data
Sea surface temperature
Sea trips 2013–2018
MODIS satellite images (Level2_LAC) 2013–2022 processed under SeaDas
(oceancolor.gsfc.nasa.gov)
Actual data
250 m 1 day
Spill info
ADIOS Oil Database
Actual data
SN Applied Sciences
(2023) 5:158
| https://doi.org/10.1007/s42452-023-05376-x
Research Article
coming from the station of Arzew. Calm and moderate
winds characterize this station in the autumn and spring
seasons. The dominant wind directions are North and
Southwest, appearing annually. About 48.6% of the
winds are between 1 and 5 m/s, 31.6% between 6 and
10 m/s, and 2.5% between 11 and 15 m/s. The most frequent speeds are those between 1 and 5 m/s (Fig. 7)
[61].
The data show that in January, calm winds of speed
1 < F(m/s) < 5 are from the Southwest (SW) direction, as
well as winds of speed 6 < F(m/s) < 10 from the westsouthwest (WSW) direction. For April, the wind force
between 6 (m/s) and 10 (m/s) is in the West direction
and is the most predominant. It is in the North direction for 01 < F(m/s) < 05. In July, the wind direction is
North, with a very high scale for 01 < F(m/s) < 05 and
06 < F(m/s) < 10. The winds in October represent a variation between two directions North and South West
(SW) [36].
2.3.2 Surface sea currents
At the level of the Gulf of Arzew, the currents are oriented
mainly toward the East. These currents flow 20–30 cm/s
off Mostaganem, 40 km from the coast, and at 50 m depth.
At the level of Arzew, a branch of this current enters the
Gulf. Under the effect of the Coriolis force, currents appear
clockwise, and their speed is very low (8 to 10 cm/s) [16].
Reliable oceanographic data are integral to oil spill vulnerability mapping and form the basis for accurate forecasting. Table 3 presents the different data sources integrated
with webGNOME software. We studied local climatology
and drew some idealized cases. For the different simulations, we created the actual data file using the dialog
boxes, variable wind, spill information, temperature and
salinity of the sea surface. These accurate data were
obtained from the meteorological station of Arzew and
the outputs at sea (in situ data).
The wind speed, direction, and values are integrated
manually using dialog boxes under the webGNOME software. The current sea data is integrated from the real-time
Fig. 9 The study area via GOODS and Integration in the webGNOME software
Table 3 WebGNOME Model inputs and sources
Inputs
Sources
Resolution spatial/temporal
Location file
https:// gnome. orr. noaa. gov/ goods (BNA map file format, Fig. 9)
50 m 30 days
Current data
The real-time RTOFS Global Ocean Model based on the HYCOM model
horizontal resolution 1/12 degrees
Horizontal Diffusion
webGNOME default value
–
Wind data
Provided by the National Climatological Center (NCC) and the weather
station of Arzew. (Fig. 10)
Actual data
Sea surface temperature
Sea trips 2013–2018
MODIS satellite images (Level2_LAC) 2013–2022 processed under SeaDas
(oceancolor.gsfc.nasa.gov)
Actual data
250 m 1 day
Spill info
ADIOS Oil Database
Actual data