

Vol:.(1234567890)
Research Article
SN Applied Sciences
(2023) 5:158
| https://doi.org/10.1007/s42452-023-05376-x
Δt = t − t 1 is the time between two steps; Δz is the vertical movement (in-depth); 111.12000024 is the number
of meters per one (1) degree of latitude; 1 nautical mile
equals 1 degree everywhere.
The distribution of the oil slick: Classical equation for the
distribution of oil slick
where, C is the concentration of the spilled quantity, and
D is the coefficient of the distribution mentioned in Eq. (3),
written as follows:
(2)
c
t
= D∇
2 C
(3)
c
t
= Dx ×
2 C
x 2 + Dy ×
2 C
y 2
Equation (3) gives the drift of the slicks in Cartesian
coordinates, where, Dx, Dy are scalar diffusion coefficients
in the x and y directions, and T is the time.
The diffusion coefficient is half the variance of the distribution of each step divided by the time step:
2.3 The input data and boundary conditions
2.3.1 Winds in the region of Arzew
The study is based on the series of daily maximum
wind speeds measured at the station of Arzew during
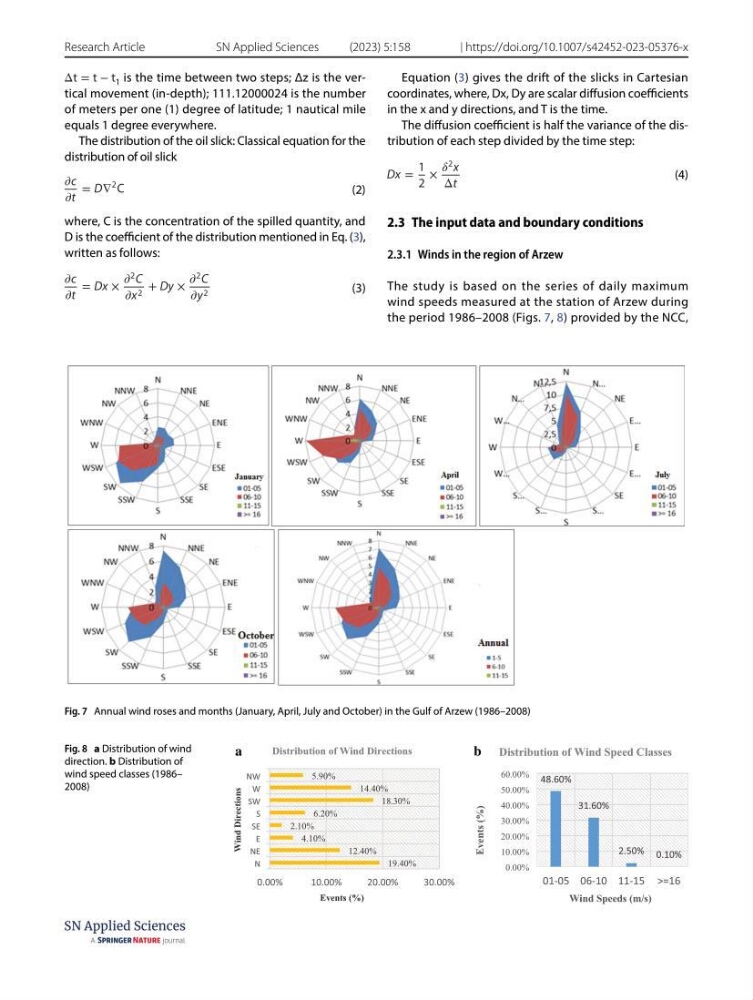
the period 1986–2008 (Figs. 7, 8) provided by the NCC,
(4)
Dx =
1
2
×
2 x
Δt
Fig. 7 Annual wind roses and months (January, April, July and October) in the Gulf of Arzew (1986–2008)
Fig. 8 a Distribution of wind
direction. b Distribution of
wind speed classes (1986–
2008)
19.40%
12.40%
4.10%
2.10%
6.20%
18.30%
14.40%
5.90%
N
NE
E
SE
S
SW
W
NW
0.00%
10.00%
20.00%
30.00%
Distribution of Wind Directions
Wind Directions
Events (%)
48.60%
31.60%
2.50% 0.10%
0.00%
10.00%
20.00%
30.00%
40.00%
50.00%
60.00%
01-05 06-10 11-15 >=16
Distribution of Wind Speed Classes
Events (%)
Wind Speeds (m/s)
a
b
Research Article
SN Applied Sciences
(2023) 5:158
| https://doi.org/10.1007/s42452-023-05376-x
Δt = t − t 1 is the time between two steps; Δz is the vertical movement (in-depth); 111.12000024 is the number
of meters per one (1) degree of latitude; 1 nautical mile
equals 1 degree everywhere.
The distribution of the oil slick: Classical equation for the
distribution of oil slick
where, C is the concentration of the spilled quantity, and
D is the coefficient of the distribution mentioned in Eq. (3),
written as follows:
(2)
c
t
= D∇
2 C
(3)
c
t
= Dx ×
2 C
x 2 + Dy ×
2 C
y 2
Equation (3) gives the drift of the slicks in Cartesian
coordinates, where, Dx, Dy are scalar diffusion coefficients
in the x and y directions, and T is the time.
The diffusion coefficient is half the variance of the distribution of each step divided by the time step:
2.3 The input data and boundary conditions
2.3.1 Winds in the region of Arzew
The study is based on the series of daily maximum
wind speeds measured at the station of Arzew during
the period 1986–2008 (Figs. 7, 8) provided by the NCC,
(4)
Dx =
1
2
×
2 x
Δt
Fig. 7 Annual wind roses and months (January, April, July and October) in the Gulf of Arzew (1986–2008)
Fig. 8 a Distribution of wind
direction. b Distribution of
wind speed classes (1986–
2008)
19.40%
12.40%
4.10%
2.10%
6.20%
18.30%
14.40%
5.90%
N
NE
E
SE
S
SW
W
NW
0.00%
10.00%
20.00%
30.00%
Distribution of Wind Directions
Wind Directions
Events (%)
48.60%
31.60%
2.50% 0.10%
0.00%
10.00%
20.00%
30.00%
40.00%
50.00%
60.00%
01-05 06-10 11-15 >=16
Distribution of Wind Speed Classes
Events (%)
Wind Speeds (m/s)
a
b