

62
4 Nanofiller Dispersion in Rubber as Revealed by 3D-TEM
example is shown in Fig. 4.5, and on each silica, i.e., the commercial precipitated
silica (VN3) and in situ silica, which displays 3D image. In the figure, silica particles
which are separated from the nearest neighbors more than 1 nm distance are shown
independently. The aggregate size of silica is larger in NR-in situ-V than in NR-mixV, and the dispersion in the former seems more homogeneous than the latter.
Based on the image in Fig. 4.5, radius of all the silica aggregates was calculated by
assuming the perfect circle of the same volume to each aggregates. The distribution
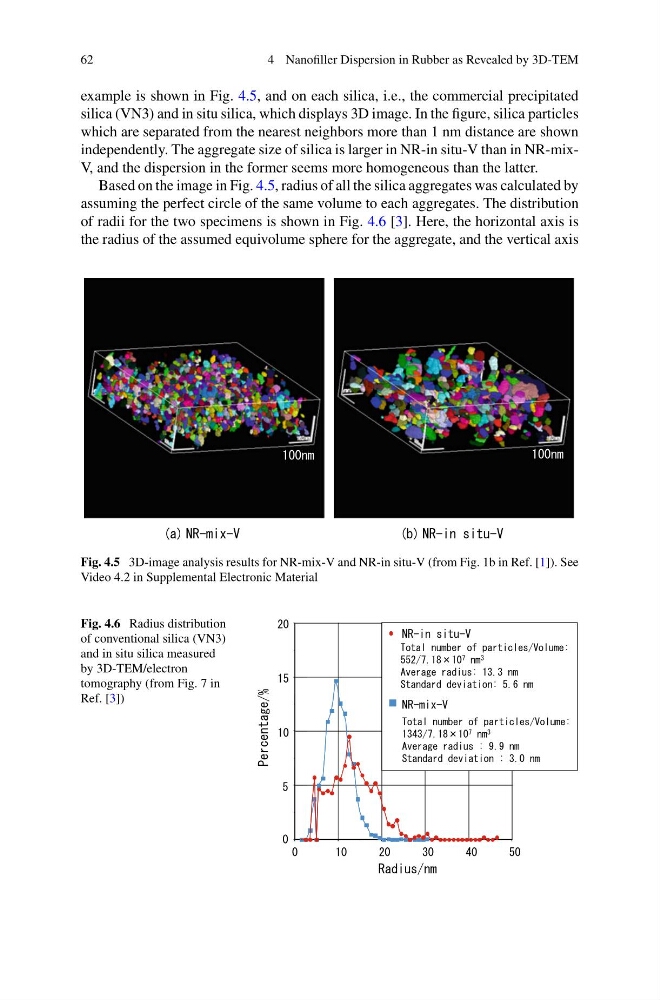
of radii for the two specimens is shown in Fig. 4.6 [3]. Here, the horizontal axis is
the radius of the assumed equivolume sphere for the aggregate, and the vertical axis
Fig. 4.5 3D-image analysis results for NR-mix-V and NR-in situ-V (from Fig. 1b in Ref. [1]). See
Video 4.2 in Supplemental Electronic Material
Fig. 4.6 Radius distribution
of conventional silica (VN3)
and in situ silica measured
by 3D-TEM/electron
tomography (from Fig. 7 in
Ref. [3])
4 Nanofiller Dispersion in Rubber as Revealed by 3D-TEM
example is shown in Fig. 4.5, and on each silica, i.e., the commercial precipitated
silica (VN3) and in situ silica, which displays 3D image. In the figure, silica particles
which are separated from the nearest neighbors more than 1 nm distance are shown
independently. The aggregate size of silica is larger in NR-in situ-V than in NR-mixV, and the dispersion in the former seems more homogeneous than the latter.
Based on the image in Fig. 4.5, radius of all the silica aggregates was calculated by
assuming the perfect circle of the same volume to each aggregates. The distribution
of radii for the two specimens is shown in Fig. 4.6 [3]. Here, the horizontal axis is
the radius of the assumed equivolume sphere for the aggregate, and the vertical axis
Fig. 4.5 3D-image analysis results for NR-mix-V and NR-in situ-V (from Fig. 1b in Ref. [1]). See
Video 4.2 in Supplemental Electronic Material
Fig. 4.6 Radius distribution
of conventional silica (VN3)
and in situ silica measured
by 3D-TEM/electron
tomography (from Fig. 7 in
Ref. [3])