

60
4 Nanofiller Dispersion in Rubber as Revealed by 3D-TEM
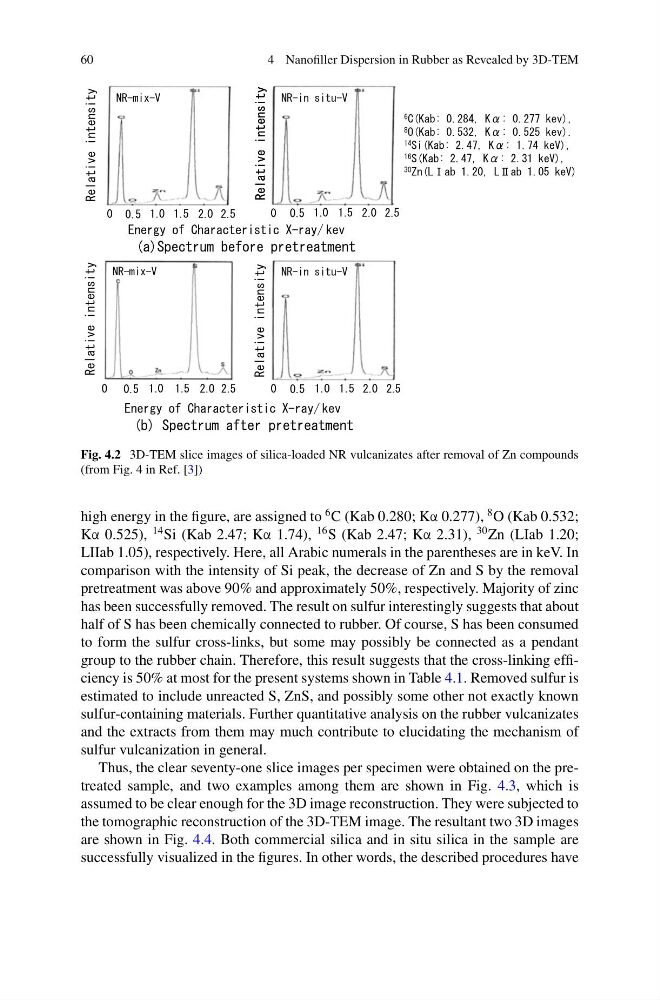
Fig. 4.2 3D-TEM slice images of silica-loaded NR vulcanizates after removal of Zn compounds
(from Fig. 4 in Ref. [3])
high energy in the figure, are assigned to
6 C (Kab 0.280; Kα 0.277),
8 O (Kab 0.532;
Kα 0.525),
14 Si (Kab 2.47; Kα 1.74),
16 S (Kab 2.47; Kα 2.31),
30 Zn (LIab 1.20;
LIIab 1.05), respectively. Here, all Arabic numerals in the parentheses are in keV. In
comparison with the intensity of Si peak, the decrease of Zn and S by the removal
pretreatment was above 90% and approximately 50%, respectively. Majority of zinc
has been successfully removed. The result on sulfur interestingly suggests that about
half of S has been chemically connected to rubber. Of course, S has been consumed
to form the sulfur cross-links, but some may possibly be connected as a pendant
group to the rubber chain. Therefore, this result suggests that the cross-linking efficiency is 50% at most for the present systems shown in Table 4.1. Removed sulfur is
estimated to include unreacted S, ZnS, and possibly some other not exactly known
sulfur-containing materials. Further quantitative analysis on the rubber vulcanizates
and the extracts from them may much contribute to elucidating the mechanism of
sulfur vulcanization in general.
Thus, the clear seventy-one slice images per specimen were obtained on the pretreated sample, and two examples among them are shown in Fig. 4.3, which is
assumed to be clear enough for the 3D image reconstruction. They were subjected to
the tomographic reconstruction of the 3D-TEM image. The resultant two 3D images
are shown in Fig. 4.4. Both commercial silica and in situ silica in the sample are
successfully visualized in the figures. In other words, the described procedures have
4 Nanofiller Dispersion in Rubber as Revealed by 3D-TEM
Fig. 4.2 3D-TEM slice images of silica-loaded NR vulcanizates after removal of Zn compounds
(from Fig. 4 in Ref. [3])
high energy in the figure, are assigned to
6 C (Kab 0.280; Kα 0.277),
8 O (Kab 0.532;
Kα 0.525),
14 Si (Kab 2.47; Kα 1.74),
16 S (Kab 2.47; Kα 2.31),
30 Zn (LIab 1.20;
LIIab 1.05), respectively. Here, all Arabic numerals in the parentheses are in keV. In
comparison with the intensity of Si peak, the decrease of Zn and S by the removal
pretreatment was above 90% and approximately 50%, respectively. Majority of zinc
has been successfully removed. The result on sulfur interestingly suggests that about
half of S has been chemically connected to rubber. Of course, S has been consumed
to form the sulfur cross-links, but some may possibly be connected as a pendant
group to the rubber chain. Therefore, this result suggests that the cross-linking efficiency is 50% at most for the present systems shown in Table 4.1. Removed sulfur is
estimated to include unreacted S, ZnS, and possibly some other not exactly known
sulfur-containing materials. Further quantitative analysis on the rubber vulcanizates
and the extracts from them may much contribute to elucidating the mechanism of
sulfur vulcanization in general.
Thus, the clear seventy-one slice images per specimen were obtained on the pretreated sample, and two examples among them are shown in Fig. 4.3, which is
assumed to be clear enough for the 3D image reconstruction. They were subjected to
the tomographic reconstruction of the 3D-TEM image. The resultant two 3D images
are shown in Fig. 4.4. Both commercial silica and in situ silica in the sample are
successfully visualized in the figures. In other words, the described procedures have