

3.2 Formation of Three-Dimensional Image by 3D-TEM
55
3.2.3 Notable Points on 3D-TEM Measurement
Although not plainly shown in Fig. 3.2, computer technology plays an indispensable
role even after the 3D images are reconstructed. Not simply displaying 3D images,
but showing lots of structural features for more detailed information is of utmost
importance. We are going to show some examples, but often we needed a new software that is not commercially available. It is expected that lots of software for the
more structural information are to be developed further, and hopefully to be supplied
at an affordable price in the near future.
It is natural to have several specific factors to be considered in the combination of
3D-TEM and computer tomography. The relationship between the tilt angle of the
sample holder and the resolution is one of them. When the specimen of thickness t 0
is tilted θ , the thickness of the film is t = t 0 /cosθ . Generally speaking, increase of
thickness brings about more interaction of electron with the specimen, to result in the
increase of an aberration. The Tecnai G2F20 TEM is equipped with the automatic
calibration function. Jinnai recommended the use of an energy filter to remove the
inelastic scattered electron [16].
In the case of thin specimen’s tilting in the sample chamber, the interference with
the pole piece at the edge of sample holder limits the tilting angle. The missing datarange where no slice image is obtained cannot be overcome without fully rotating,
and thus it is necessary to widen the tilt angle as possible [20]. Mechanical limits
for rotation in the chamber due to the shape and size of the holder are also to be
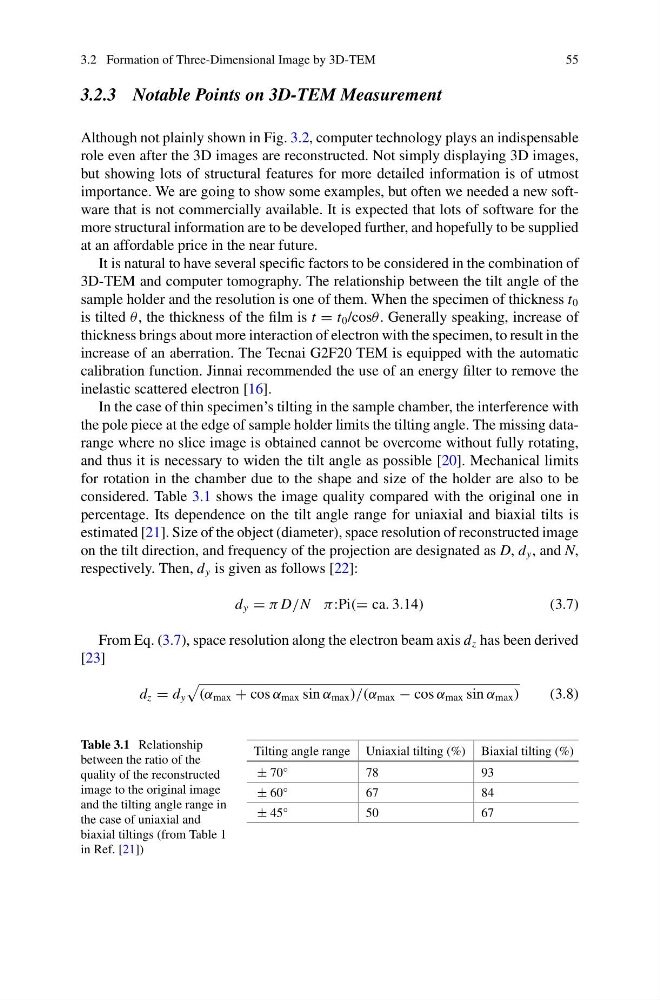
considered. Table 3.1 shows the image quality compared with the original one in
percentage. Its dependence on the tilt angle range for uniaxial and biaxial tilts is
estimated [21]. Size of the object (diameter), space resolution of reconstructed image
on the tilt direction, and frequency of the projection are designated as D, d y , and N,
respectively. Then, d y is given as follows [22]:
d y = π D/N π :Pi(= ca. 3.14)
(3.7)
From Eq. (3.7), space resolution along the electron beam axis d z has been derived
[23]
d z = d y
(α max + cos α max sin α max )/(α max − cos α max sin α max )
(3.8)
Table 3.1 Relationship
between the ratio of the
quality of the reconstructed
image to the original image
and the tilting angle range in
the case of uniaxial and
biaxial tiltings (from Table 1
in Ref. [21])
Tilting angle range Uniaxial tilting (%) Biaxial tilting (%)
± 70°
78
93
± 60°
67
84
± 45°
50
67
55
3.2.3 Notable Points on 3D-TEM Measurement
Although not plainly shown in Fig. 3.2, computer technology plays an indispensable
role even after the 3D images are reconstructed. Not simply displaying 3D images,
but showing lots of structural features for more detailed information is of utmost
importance. We are going to show some examples, but often we needed a new software that is not commercially available. It is expected that lots of software for the
more structural information are to be developed further, and hopefully to be supplied
at an affordable price in the near future.
It is natural to have several specific factors to be considered in the combination of
3D-TEM and computer tomography. The relationship between the tilt angle of the
sample holder and the resolution is one of them. When the specimen of thickness t 0
is tilted θ , the thickness of the film is t = t 0 /cosθ . Generally speaking, increase of
thickness brings about more interaction of electron with the specimen, to result in the
increase of an aberration. The Tecnai G2F20 TEM is equipped with the automatic
calibration function. Jinnai recommended the use of an energy filter to remove the
inelastic scattered electron [16].
In the case of thin specimen’s tilting in the sample chamber, the interference with
the pole piece at the edge of sample holder limits the tilting angle. The missing datarange where no slice image is obtained cannot be overcome without fully rotating,
and thus it is necessary to widen the tilt angle as possible [20]. Mechanical limits
for rotation in the chamber due to the shape and size of the holder are also to be
considered. Table 3.1 shows the image quality compared with the original one in
percentage. Its dependence on the tilt angle range for uniaxial and biaxial tilts is
estimated [21]. Size of the object (diameter), space resolution of reconstructed image
on the tilt direction, and frequency of the projection are designated as D, d y , and N,
respectively. Then, d y is given as follows [22]:
d y = π D/N π :Pi(= ca. 3.14)
(3.7)
From Eq. (3.7), space resolution along the electron beam axis d z has been derived
[23]
d z = d y
(α max + cos α max sin α max )/(α max − cos α max sin α max )
(3.8)
Table 3.1 Relationship
between the ratio of the
quality of the reconstructed
image to the original image
and the tilting angle range in
the case of uniaxial and
biaxial tiltings (from Table 1
in Ref. [21])
Tilting angle range Uniaxial tilting (%) Biaxial tilting (%)
± 70°
78
93
± 60°
67
84
± 45°
50
67