

PAPA main chain structures, show similar absorption spectra. On the other hand,
PA14, which has a PDPA main chain structure, exhibits three absorption peaks at
280, 380, and 430 nm (Fig. 3b) corresponding to the absorption of the PCH moiety,
the trans-stilbene structure, and the polyene main chain, respectively. PA12, which
has a PDPA main chain structure, also exhibited two absorbance peaks
corresponding to the polyene main chain and the trans-stilbene moiety.
The PL spectra of PA11, PA13 (Fig. 3a), and PA15 show blue-colored emission,
with their maximum emission (Em max ) being around 480 nm. The PA14, with a
PDPA main chain structure, has green fluorescence with an Em max around 500 nm
(Fig. 3b). PA12 also exhibits green luminescence at 520 nm. Previously, we elucidated the origin of emission of substituted PAs and investigated the fluorescent
trends of di-LCPA. In the earlier work, we observed that di-LCPAs with PAPA and
PDPA structures generally exhibit blue and green emissions, respectively. The green
emission color of the latter is associated with the PDPA structure in which two bulky
phenyl rings are directly attached to the polyene main chain. Specifically, the two
bulky side chains contribute to lower the 1B u excited state and hence to decrease the
band gap (Fig. 2) (Shukla and Mazumdar 1999; Ghosh et al. 2000), resulting in a
bathochromic shift of the emission bands of PA12 and PA14. Generally, the PAs
show small emission shifts between the solution and cast film, which is especially
advantageous for applications of di-PAs as fluorescent materials in EL devices.
Liquid Crystallinity of the Di-LCPAs
The di-LCPAs exhibited thermotropic and lyotropic liquid crystallinity. The Group
1 and Group 2 di-LCPAs show side chain type liquid crystallinity where their LC
phases are summarized in Table 1.
POM analysis revealed that PA11 has a N-LC phase with a Schlieren texture
(Fig. 4a) and no isotropic phase. The temperature ranges of the N-LC phase were
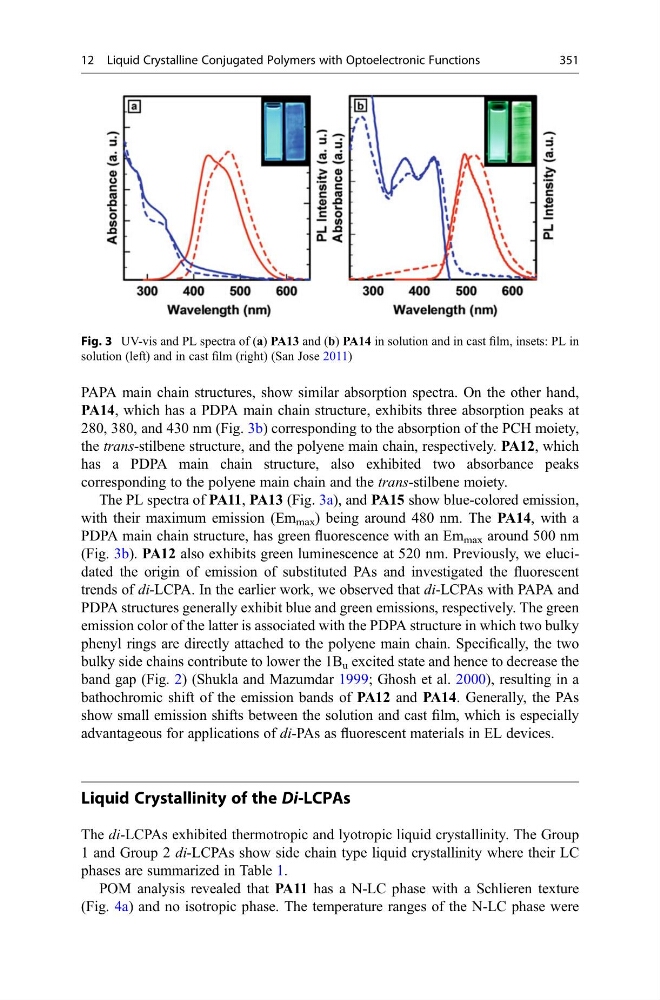
Fig. 3 UV-vis and PL spectra of (a) PA13 and (b) PA14 in solution and in cast film, insets: PL in
solution (left) and in cast film (right) (San Jose 2011)
12 Liquid Crystalline Conjugated Polymers with Optoelectronic Functions
351
PA14, which has a PDPA main chain structure, exhibits three absorption peaks at
280, 380, and 430 nm (Fig. 3b) corresponding to the absorption of the PCH moiety,
the trans-stilbene structure, and the polyene main chain, respectively. PA12, which
has a PDPA main chain structure, also exhibited two absorbance peaks
corresponding to the polyene main chain and the trans-stilbene moiety.
The PL spectra of PA11, PA13 (Fig. 3a), and PA15 show blue-colored emission,
with their maximum emission (Em max ) being around 480 nm. The PA14, with a
PDPA main chain structure, has green fluorescence with an Em max around 500 nm
(Fig. 3b). PA12 also exhibits green luminescence at 520 nm. Previously, we elucidated the origin of emission of substituted PAs and investigated the fluorescent
trends of di-LCPA. In the earlier work, we observed that di-LCPAs with PAPA and
PDPA structures generally exhibit blue and green emissions, respectively. The green
emission color of the latter is associated with the PDPA structure in which two bulky
phenyl rings are directly attached to the polyene main chain. Specifically, the two
bulky side chains contribute to lower the 1B u excited state and hence to decrease the
band gap (Fig. 2) (Shukla and Mazumdar 1999; Ghosh et al. 2000), resulting in a
bathochromic shift of the emission bands of PA12 and PA14. Generally, the PAs
show small emission shifts between the solution and cast film, which is especially
advantageous for applications of di-PAs as fluorescent materials in EL devices.
Liquid Crystallinity of the Di-LCPAs
The di-LCPAs exhibited thermotropic and lyotropic liquid crystallinity. The Group
1 and Group 2 di-LCPAs show side chain type liquid crystallinity where their LC
phases are summarized in Table 1.
POM analysis revealed that PA11 has a N-LC phase with a Schlieren texture
(Fig. 4a) and no isotropic phase. The temperature ranges of the N-LC phase were
Fig. 3 UV-vis and PL spectra of (a) PA13 and (b) PA14 in solution and in cast film, insets: PL in
solution (left) and in cast film (right) (San Jose 2011)
12 Liquid Crystalline Conjugated Polymers with Optoelectronic Functions
351